


XRP recovers on Solana cryptic video hints at a partnership




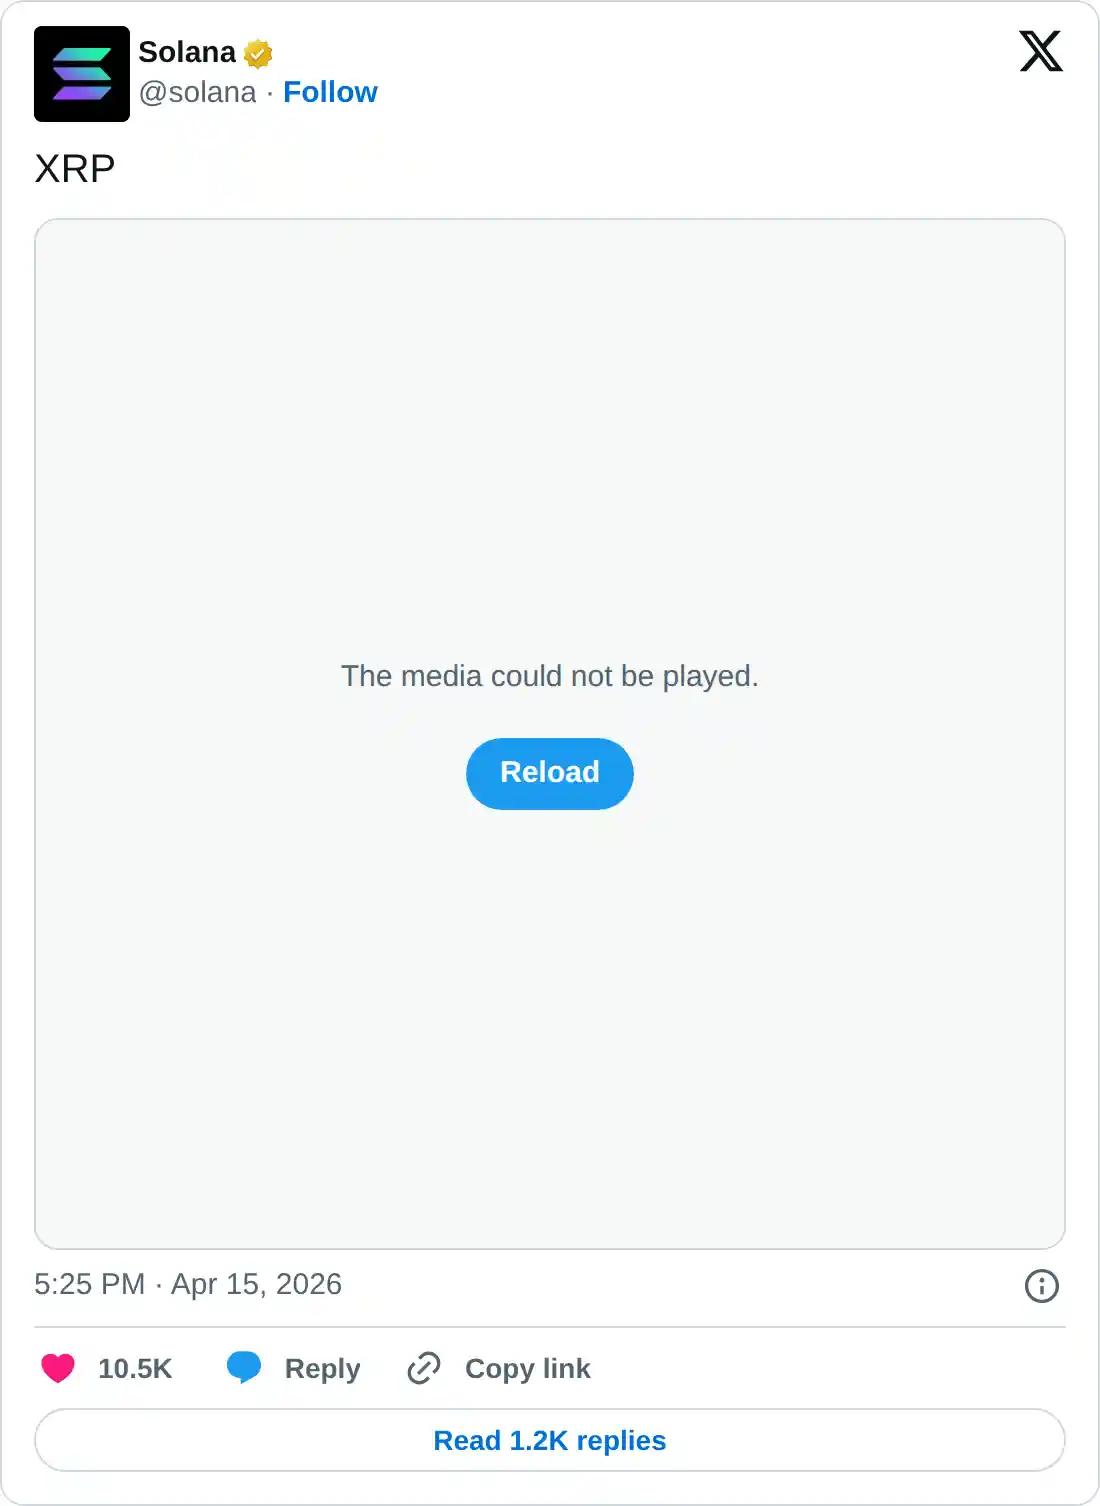
- Solana posted a cryptic short video of Ripple’s logo with the caption "XRP," brewing anticipation in the crypto community.
- A surge in Open Interest for SOL and XRP futures suggests renewed investor demand.
- The technical outlook for XRP and SOL focuses on the 50-day EMA as the immediate resistance.
Solana (SOL) hints at a potential collaboration with Ripple (XRP) with a short, cryptic video release featuring both their logos and the caption “XRP.” The anticipation among investors drives a surge in demand for XRP and SOL derivatives. Technically, XRP and SOL trade below their 50-day Exponential Moving Average (EMA), testing an upside breakout.
Solana releases a cryptic XRP collaboration message
Solana and Ripple rank among the top 10 cryptocurrencies by market capitalization, and a potential collaboration between the two giants is boosting market anticipation. Solana shared a 4-second clip featuring the XRP and SOL logos and posted replies including “we signed 589 NDAs” and “time to flip the switch.”
On the other hand, Ripple has yet to reveal any information about a potential partnership, and its socials remain focused on its annual flagship conference, Swell 2026.
Meanwhile, on the derivatives side, XRP and SOL futures Open Interest (OI) have surged 5% and 1% over the last 24 hours to $2.62 billion and $4.96 billion, respectively. This indicates a buildup in leverage in the XRP and SOL markets as investors anticipate potential upside.
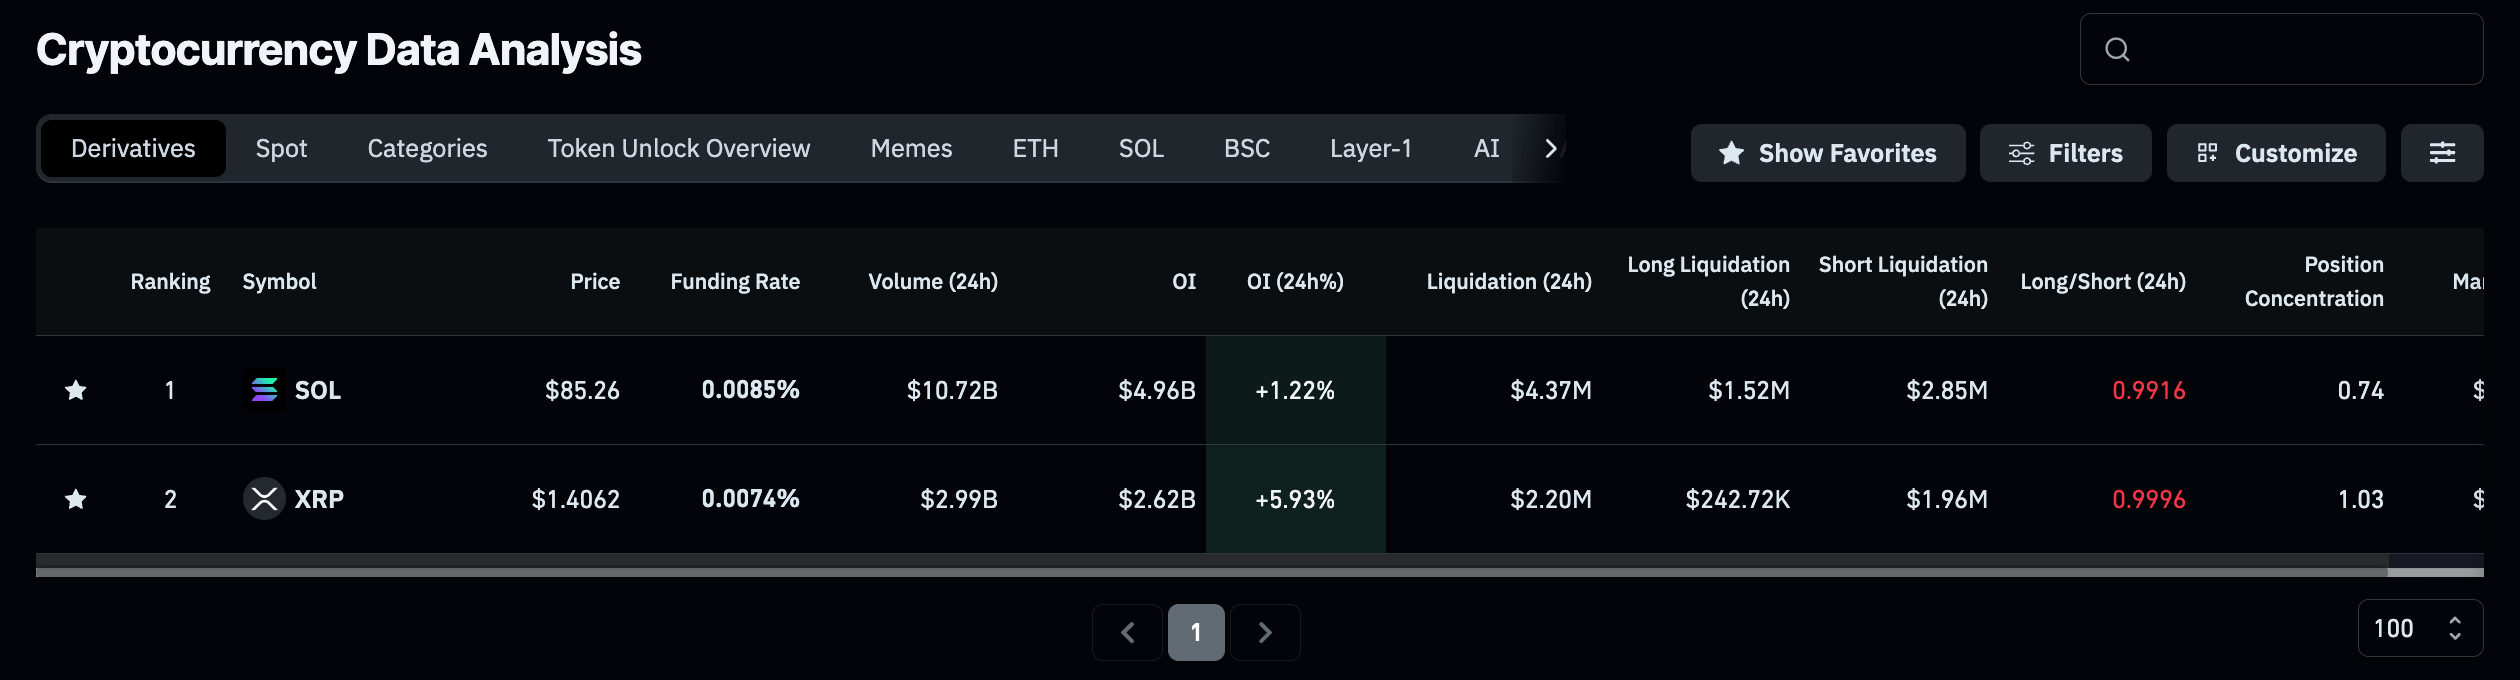
XRP and SOL derivatives data. Source: CoinGlass
Will XRP and SOL ignite a rally?
XRP extends its gains at press time on Thursday, testing the 50-day Exponential Moving Average (EMA) at $1.4062 and trading above the broken downtrend resistance line, now offering support around $1.3583, which together hint at a mildly constructive bias. However, XRP still remains capped below the 100-day EMA at $1.5496 and the 200-day EMA at $1.7966.
The Moving Average Convergence Divergence (MACD) histogram is positive with the MACD line above its signal and the Relative Strength Index (RSI) at 57, suggesting improving bullish momentum rather than overbought conditions.
On the topside, initial resistance is seen at the 100-day EMA around $1.55, followed by the 200-day EMA near $1.80, where the broader downtrend context is likely to reassert itself unless decisively cleared.
XRP/USDT daily price chart.
On the downside, immediate support aligns with the 50-day EMA at $1.41, with the former descending trend line around $1.36 providing a secondary floor.
Similarly, Solana remains under clear downside pressure, holding below the 50-day, 100-day, and 200-day EMAs, which are clustered from roughly $87.26 to $116.59.
Despite a mildly constructive momentum backdrop, the MACD holds above its signal line, and the RSI at 51 hovers near the midline, suggesting recent selling is losing intensity rather than reversing the broader downtrend.
On the topside, immediate resistance lies at the 50-day EMA around $87.26, with additional supply at the 100-day EMA near $98.02, followed by the 200-day EMA at about $116.59.
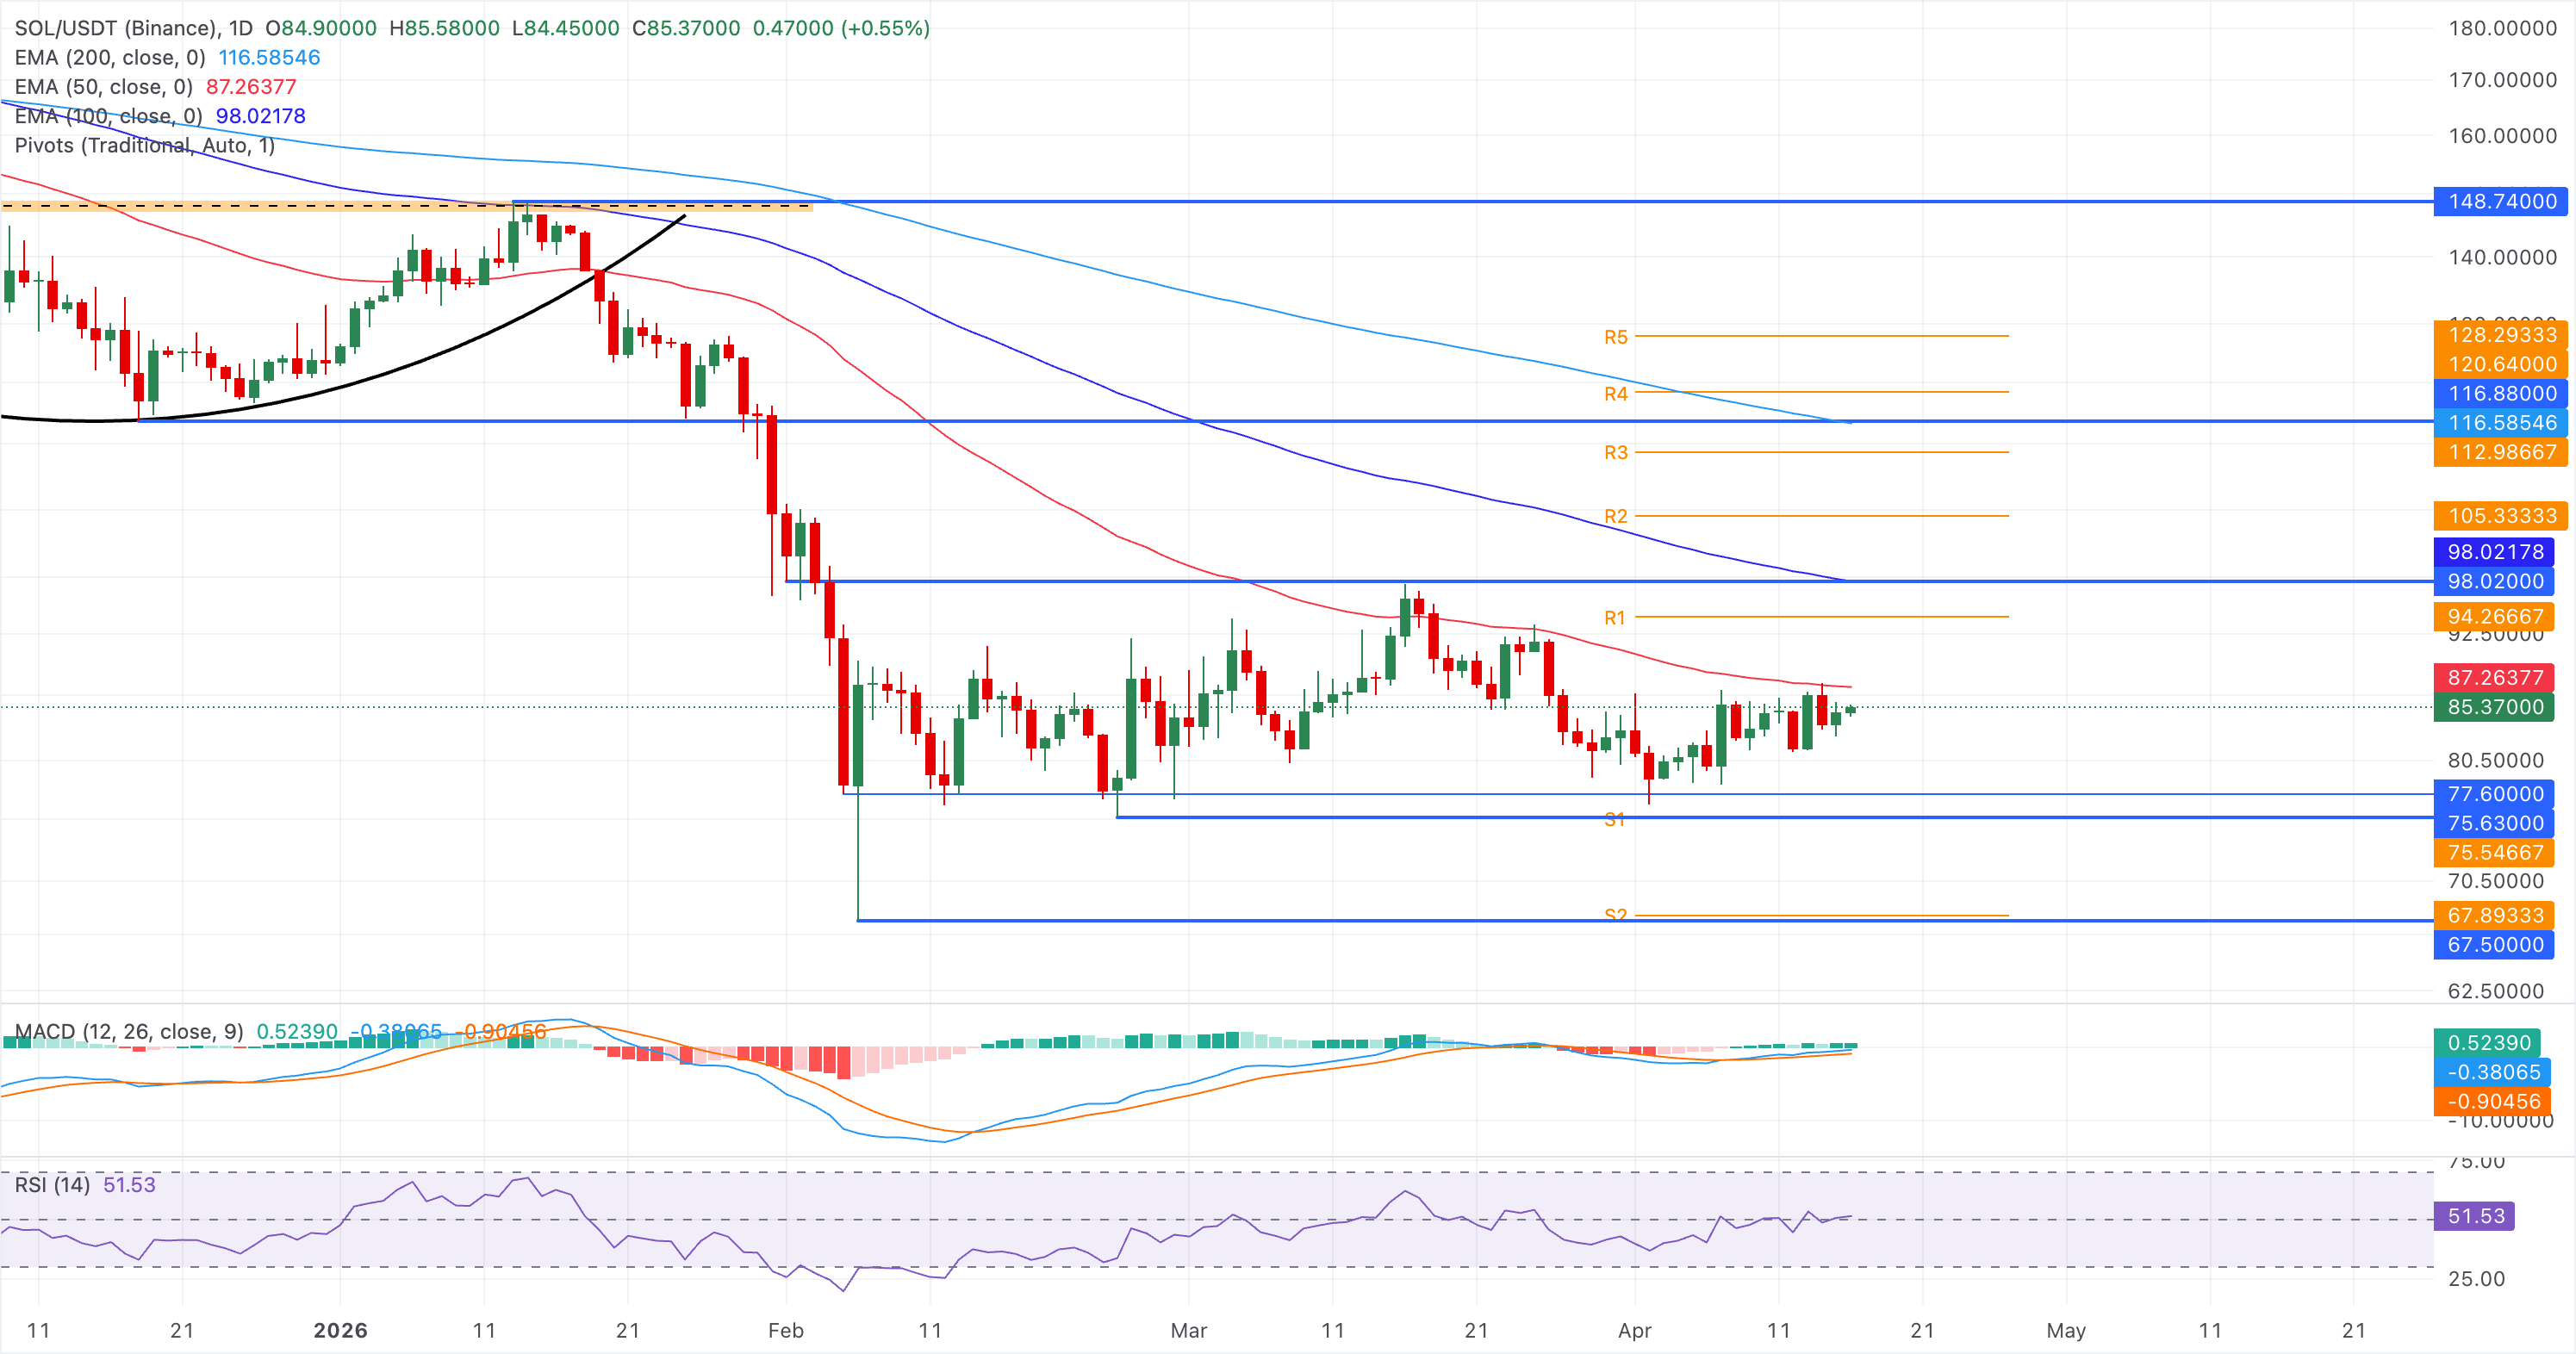
SOL/USDT daily price chart.
Looking down, the key support levels for Solana are at the February 5 and 6 lows at $77.60 and $67.50, respectively.
(The technical analysis of this story was written with the help of an AI tool.)
Recommended Articles












Comments (0)
Click the $ button, enter the symbol, and select to link a stock, ETF, or other ticker.