


Solana Price Prediction: SOL at $78 — Is $100 Still the H2 2026 Target?



AI Podcast


Solana (SOL) currently maintains a critical support zone between $76 and $78, acting as a foundation for potential recovery. Analysts suggest that sustaining this level is vital for bullish momentum. Achieving a $100 price target in H2 2026 is supported by strong network activity, historical SOL/BTC correlation, and favorable seasonal trends. Technical indicators show diminished selling pressure and a neutral RSI, suggesting room for growth. However, macro-financial headwinds, including high interest rates and geopolitical instability, remain significant risks. A confirmed breakout above $82 is viewed as the primary technical catalyst for reaching the $100 objective.
TradingKey - This year has been nothing short of a wild ride for Solana (SOL). From a peak of $149, Solana price tumbled to $60 in June. Solana briefly reclaimed $80 in July but now hovers right around $78. Less than a year ago, the Solana community was confidently talking about triple digits.
But since then, they have had one big question though with the bear market. Will the $100 price-mark for Solana in the second half of the year be achieved? Let’s break down the charts, market sentiment and the fundamental drivers to see where Solana is headed.
The Battle at $78: Why This Support Floor Matters
To figure out where Solana is going, we have to look closely at where it is standing. Right now, the $76 to $78 price zone is acting as a massive safety net. Solana price is currently trading around $77.5 and sits in the critical line for traders.
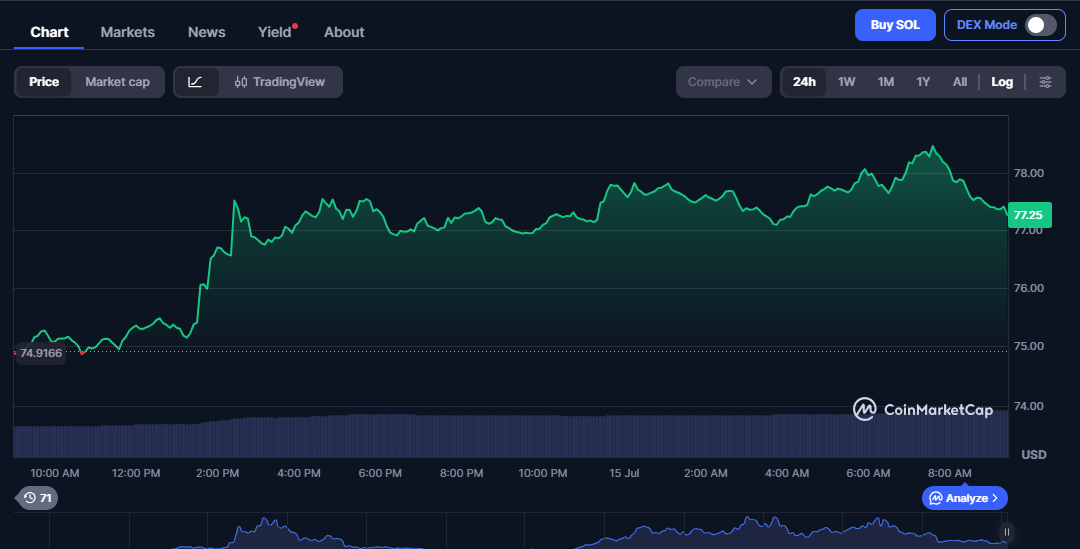
Think of this support level as important because it has acted as a tightly coiled spring. Every time the price dips into this area, buyers quickly step in. They buy up the discount, which pushes the price right back up.
Analysts across the board agree that holding this $76 support is absolutely vital. If SOL remains above this level, it remains bullish. Even as the overall crypto market is taking a breather, it showcases that there is still a demand for these digital currencies.
What Could Push the Solana Price To $100 in H2 2026?
While holding the $76-$78 range is key, reaching $100 is not just a random dream. There are concrete reasons why we could see the Solana price pump to $100 before the end of H2 2026. First, let’s talk about network activity. Solana remains the absolute go-to blockchain for fast and cheap transactions.
Whether it is the ongoing memecoin craze or new decentralized finance (DeFi) applications, developers and users are sticking with Solana. This constant network usage creates an organic, daily demand for SOL tokens.
To hit $100 from its current price of $78, Solana only needs about a 28% rally. We have already seen Solana price pull off more than a 28% jump in a single week. One major reason this could happen can be seen on the SOL/BTC chart, as highlighted by Friedrich.
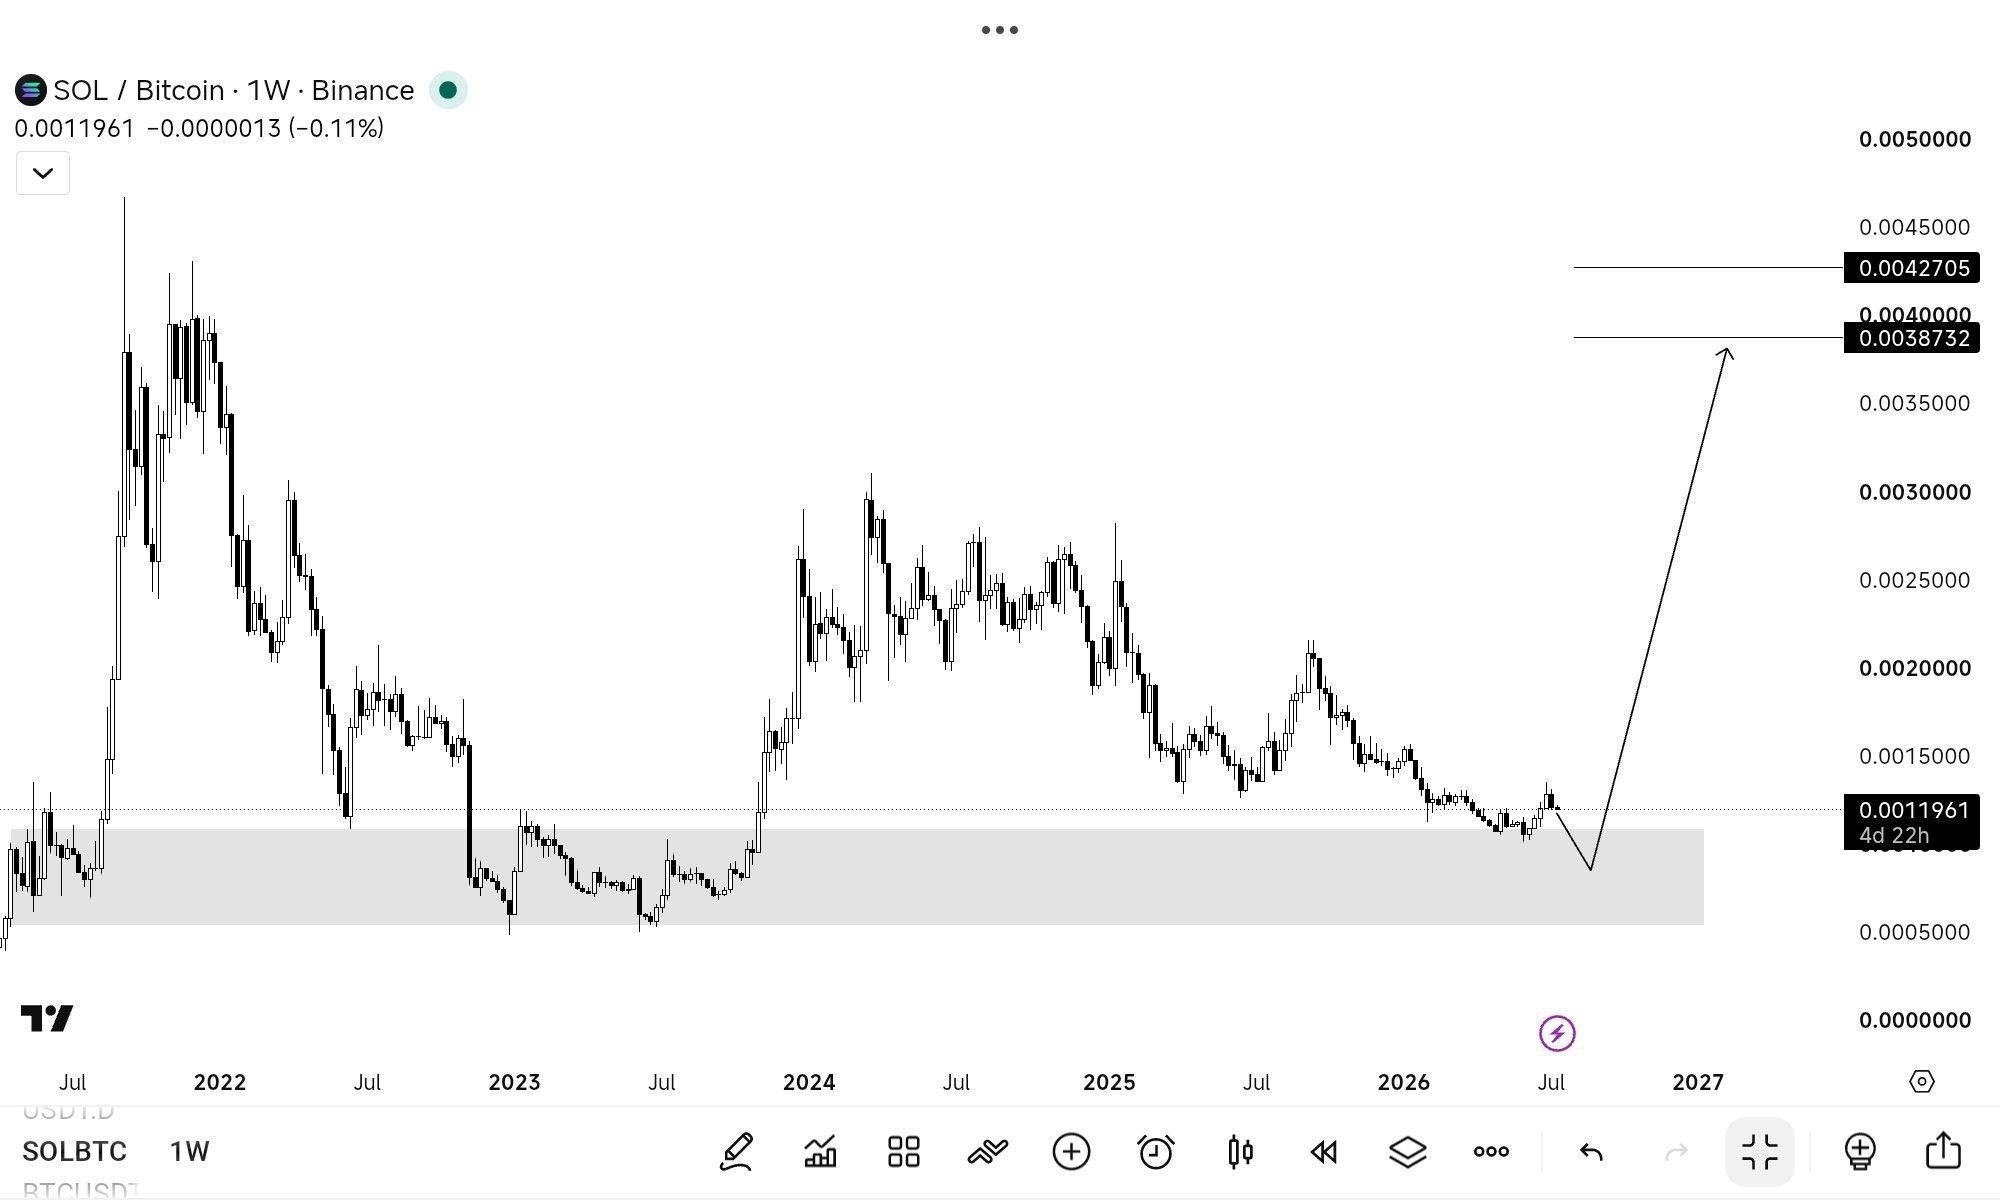
SOL/BTC has dropped into a range that historically leads to a major price pump. The notable Solana price rallies of 2021 and 2023 happened when SOL/BTC dropped into this range. While we may see a brief consolidation in this range, we expect a breakout before the end of the year.
When this happens, Solana price would rise above the $100 mark. And when the breakout is complete, Friedrich predicts that SOL price could easily trade between $500 and $800. Another reason for the bullish belief in Solana is historical market cycles.
Historically, Solana tends to perform better in the second half of the year. Often, H2 brings renewed liquidity and excitement to the crypto space. If Bitcoin manages to stabilize and go on a mini-run, Solana is historically one of the first altcoins to rocket upward.
The Technical Picture: Coiling for a Move
When you look at the technical indicators, Solana has been experiencing a bit of consolidation. The mood has been cautious but quietly confident. The moving averages are starting to flatten out. This indicates that the strong selling pressure witnessed earlier may finally be losing momentum.
Moreover, the Relative Strength Index (RSI) is in neutral zone. It is neither overbought nor oversold. This is a good condition as the price has enough space to move higher without coming across any technical resistance.
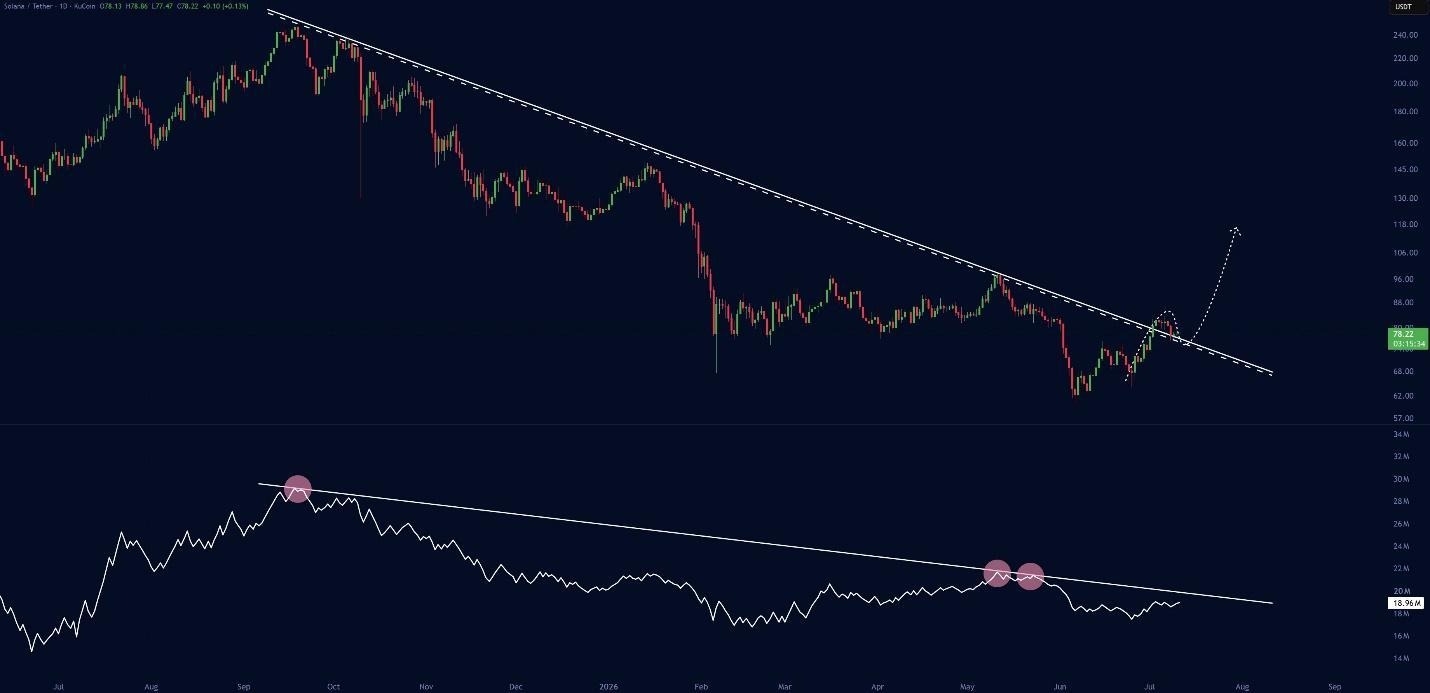
Many smart money traders are already waiting for a breakout. A chart shared by Jesse Peralta shows that Solana has tested a long-term downtrend resistance, with a confirmed breakout opening the path towards $90 and $100. A clean daily break above $82 would likely trigger this rally.
The Bottom Line
Will Solana price still hit $100 in H2? Yes, the target is still very much alive. The foundation is solid, the support level is holding, and the ecosystem is busier than ever. While a dip below $76 would certainly delay the timeline, the bulls still hold the upper hand for now.
The major challenges Solana may face are on a macro level, as global financial pressure is still a headache. High interest rates and rising tensions in Iran could sway the direction of the market. If Solana weathers that storm, keep an eye on $78 and $82, as they could signal the start of the $100 run.
Recommended Articles









Comments (0)
Click the $ button, enter the symbol, and select to link a stock, ETF, or other ticker.