


Uniswap (UNI) Surges Over 10% Defying Trend to Hit Eight-Month High Near $6



AI Podcast


Uniswap surged over 10% intraday against a broader market crash on September 2, approaching $6 to hit an eight-month high. This rally was driven by safe-haven capital seeking on-chain real-world asset tokens and robust activity on Robinhood Chain, where Uniswap generated over $9 million in daily fees to support token buybacks. UNI futures open interest reached $500 million, signaling strong institutional bullishness. While a close above $6 could target $10, key resistance remains at this heavy trading density zone. Downside risks persist from geopolitical tensions, macroeconomic data, and potential Bitcoin weakness below $75,000.
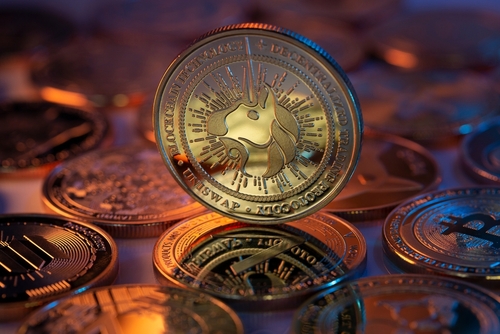
TradingKey - Uniswap surges over 10% intraday against the market trend, strongly approaching the $6 mark to hit a new high since January.
On September 2, amid escalating US-Iran geopolitical tensions and a broad market crash triggered by Bitcoin falling below $78,000, Uniswap (UNI) demonstrated remarkable resilience against the market trend with an independent rally, surging over 10% in a single day to approach the $6.00 mark and setting an eight-month high since January.
In addition to flowing into stablecoins, safe-haven capital is also seeking real-world asset (RWA) tokens such as tokenized US Treasuries on-chain, driving liquidity and trading demand in relevant Uniswap pools. Data shows that the trading volume of tokenized RWA assets flowing through the Uniswap protocol grew 20% week-on-week.
In addition, Robinhood Chain's TVL continues to climb to record highs, exceeding $700 million. Among them, Uniswap remains its largest protocol, generating over $9 million in fees over the past 24 hours and earning more than $400,000 in revenue, which helps to further buy back and burn UNI.
Catalyzed by fundamentals, UNI futures open interest jumped to $500 million, reaching a new high since November last year. This indicates that institutional and major capital are strongly bullish across spot and derivatives markets, with significant upward momentum driven by key buyers.
From the perspective of UNI's key technical levels and token distribution structure, if the daily chart successfully closes above $6.00, it is expected to open a new round of medium-to-long-term valuation recovery, challenging $10 on the upside. However, $6 is a previous breakout level and a heavy trading density zone, which could face selling pressure, while the primary downside support lies near $5.5.
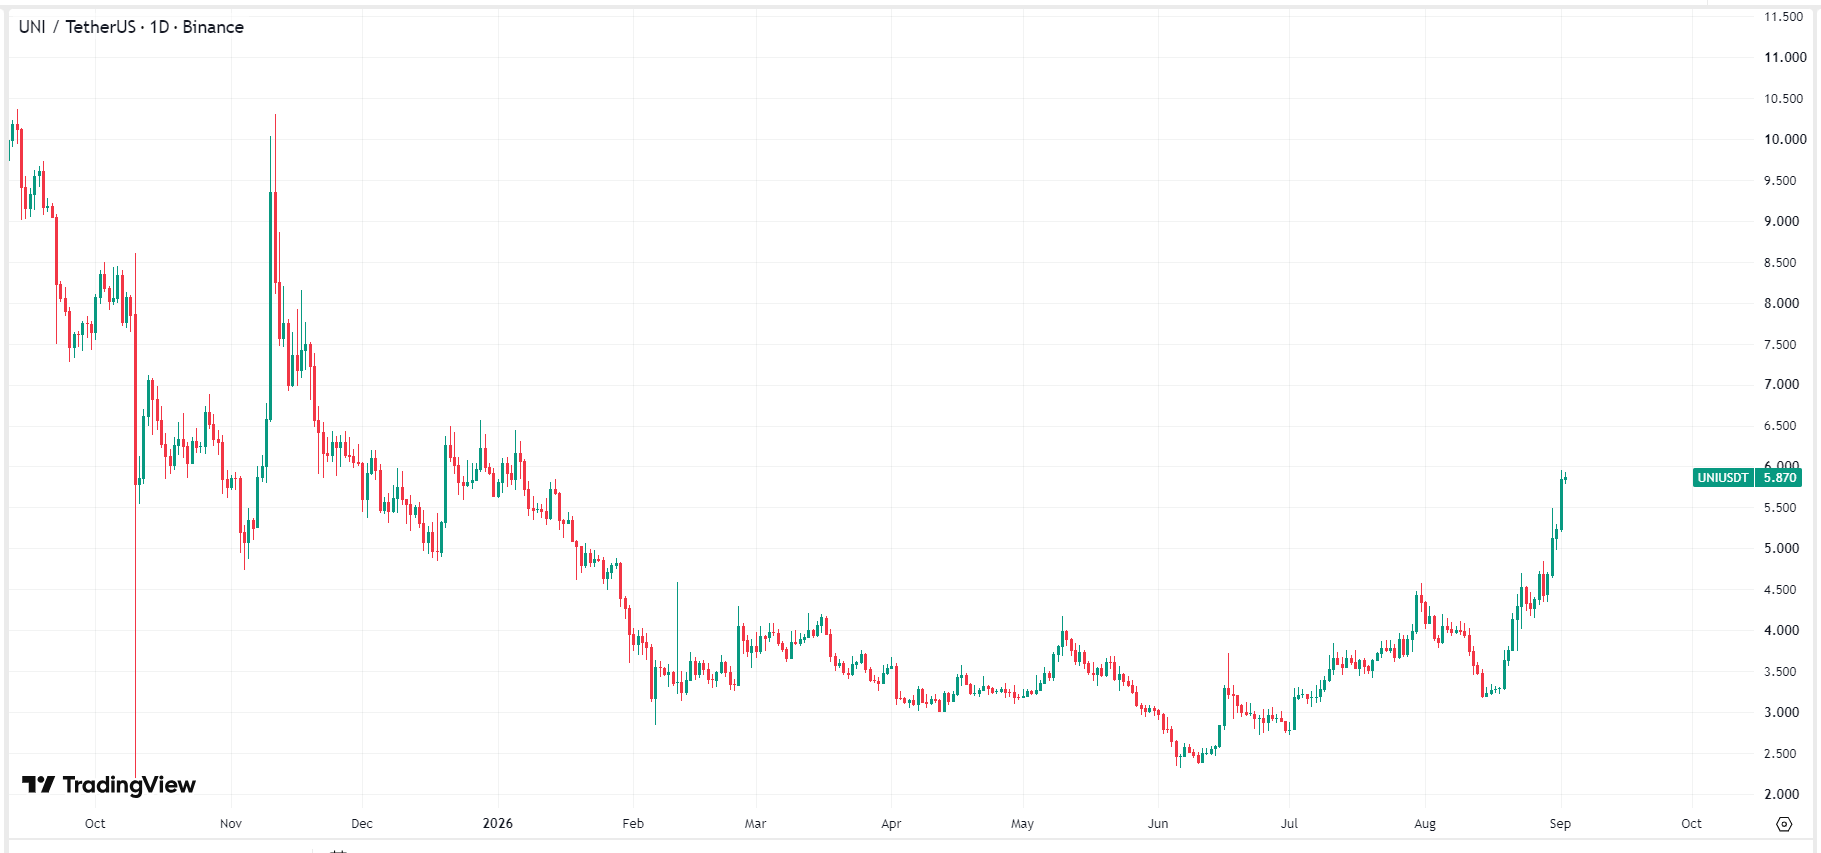 UNI price chart, Source: TradingView
Although UNI has shown strong performance, the overall crypto market is currently under pressure from both US-Iran tensions and the upcoming non-farm payrolls data. If Bitcoin (BTC) drops sharply further below $75,000, UNI could also be dragged lower.
This content was translated using AI and reviewed for clarity. It is for informational purposes only.
Recommended Articles









Comments (0)
Click the $ button, enter the symbol, and select to link a stock, ETF, or other ticker.