


Ethereum Staking Hits Record 40 Million: Why Is ETH Price Falling Instead of Rising?



AI Podcast


As of August 11, Ethereum staking reached a record 42 million ETH, yet prices fell over 2% to $1,874.67. This discrepancy stems from liquid staking derivatives maintaining market liquidity and low on-chain activity hindering the burn mechanism, leading to slight inflation. Furthermore, tight macro liquidity and lackluster spot ETF inflows limit upward momentum. Technically, ETH is consolidating between $1,800 and $2,000. A breakout above $2,000 could target $2,500, while failure to hold the $1,800 support level risks a retest of the $1,500 floor, though the medium-term bullish structure remains intact pending broader capital inflows.

TradingKey - On August 11, Ethereum ( ETH) staking volume hit another historic high. According to data, the amount of staked ETH rose to approximately 42 million, accounting for one-third of Ethereum's total supply. Although such a large volume of ETH did not enter circulation, its price failed to rise. Instead, it fell more than 2% today, slipping below the $1,900 threshold and temporarily trading at $1,874.67.
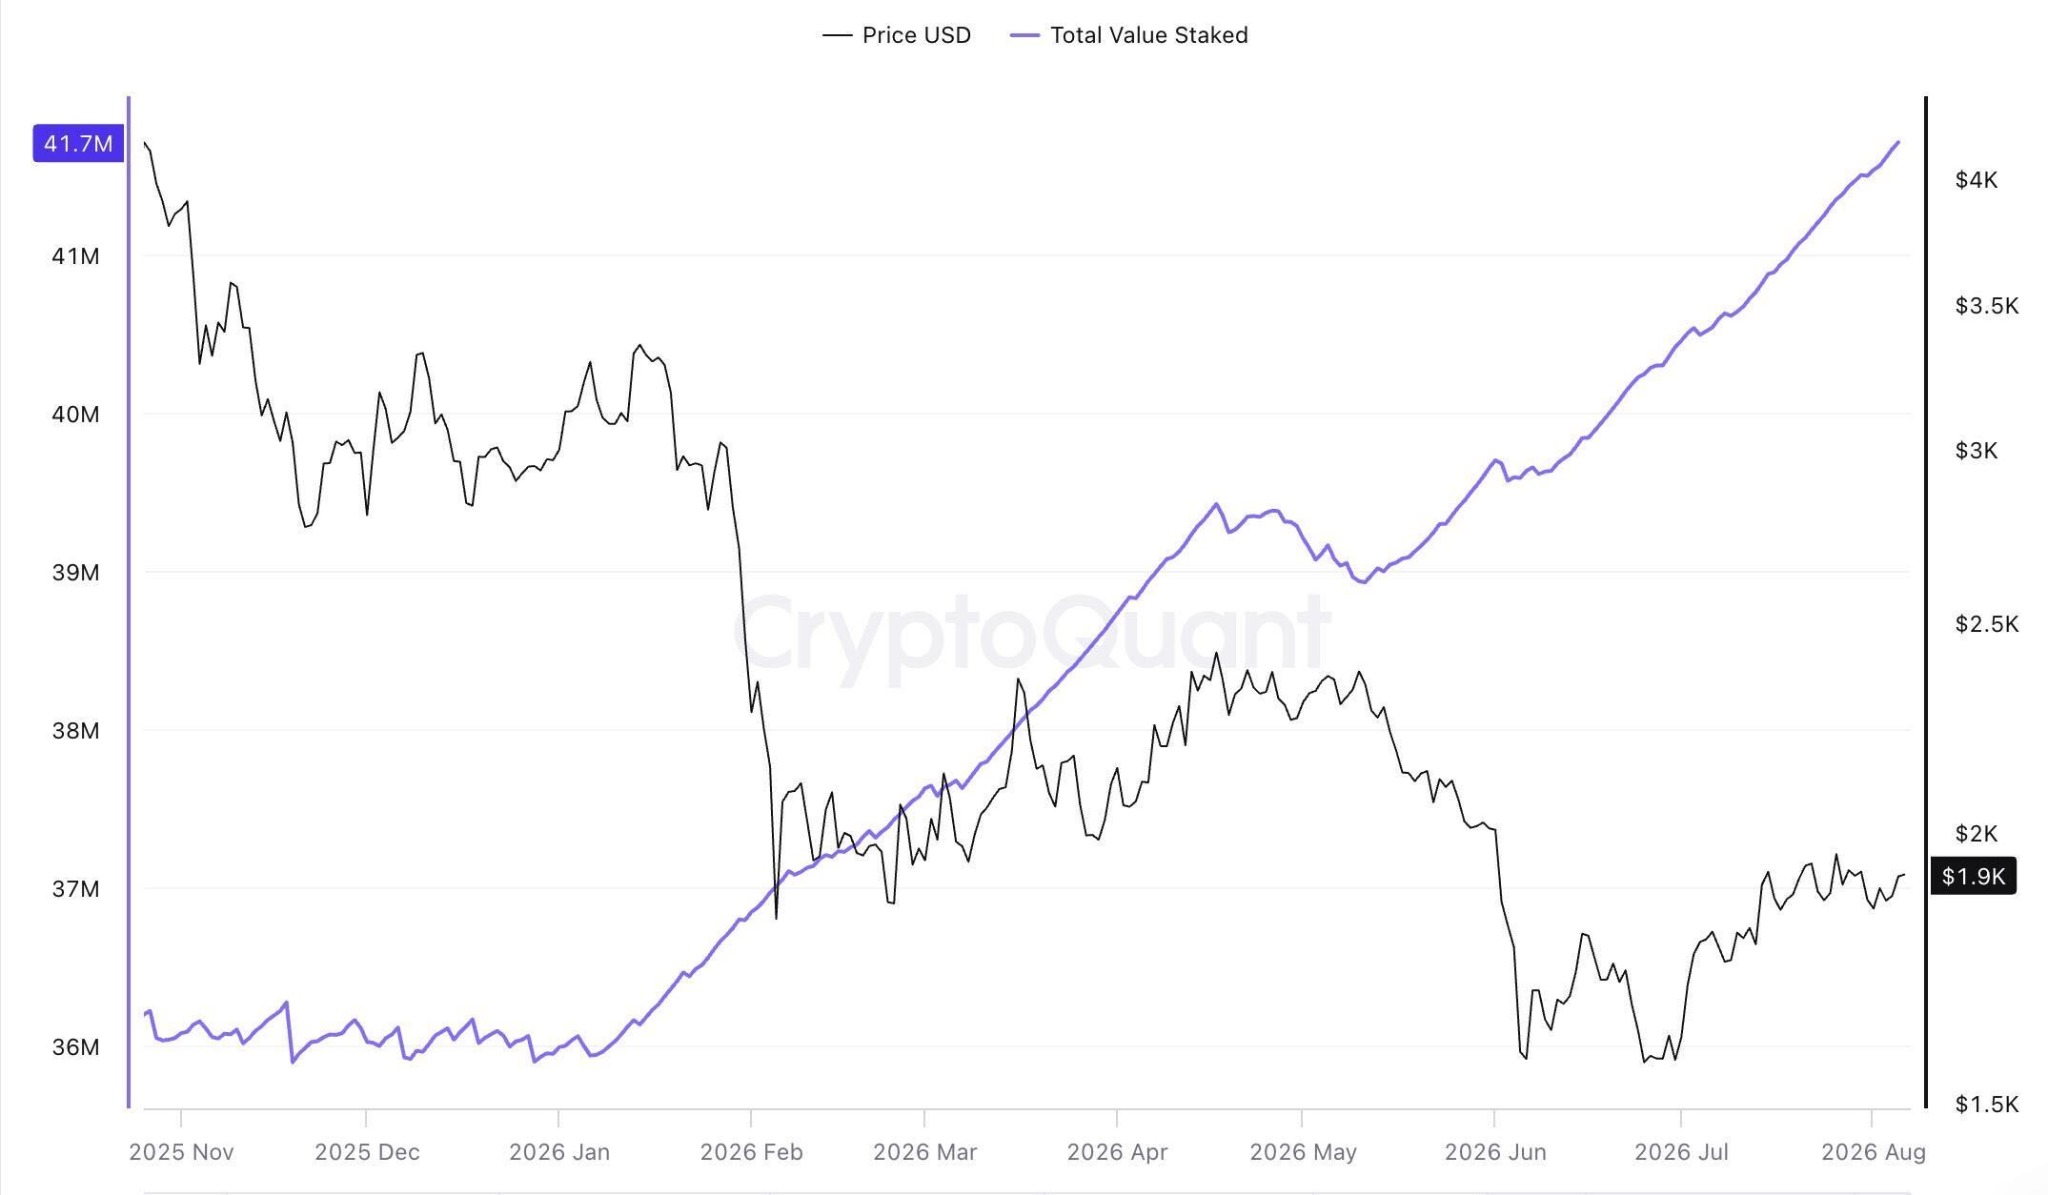 ETH Staking Volume and Price, Source: CryptoQuant
Why Ethereum Price Falls Instead of Rising?
Although a large amount of ETH is staked in the Beacon Chain, most of it is done through liquid staking protocols such as Lido, meaning stakers receive equivalent derivative tokens such as stETH and eETH, which can be freely traded, liquidated as collateral, or sold off as liquidity in DeFi. Therefore, a record high in staked volume does not equate to potential selling pressure in circulation being completely locked up.
In addition, weak on-chain activity has led to a rising ETH inflation rate and the failure of the burn mechanism. Significant surges in Ethereum's price often rely on high Gas fees to burn ETH, thereby achieving deflation. However, because Layer 2 networks divert a large volume of mainnet transactions, mainnet Gas fees have remained low for a prolonged period, leading to a sharp reduction in the amount of ETH burned. As the total amount of staked ETH increases, the rewards paid by the network to validators increase accordingly. In the absence of sufficient burning, the total supply of ETH has instead shown a state of slight inflation, weakening its deflationary narrative.
Will Ether Prices Rise Further?
Although ETH staking has mitigated some selling pressure, a genuine trend reversal for ETH still depends on liquidity spillovers from a macro rate-cut cycle to attract capital inflows. Against the current macroeconomic backdrop of high interest rates and a wait-and-see stance on Federal Reserve (Fed) policy, market liquidity remains generally tight, and spot ETH ETFs lack sustained net inflows.
So far this year, inflows into spot Ethereum ETFs have plunged, with daily inflows remaining mostly below $200 million, accompanied by substantial outflows that have left net inflows even lower. In contrast, in 2025, capital inflows have been continuous and massive, with daily inflows reaching $600 million or even $900 million, multiple times the current level.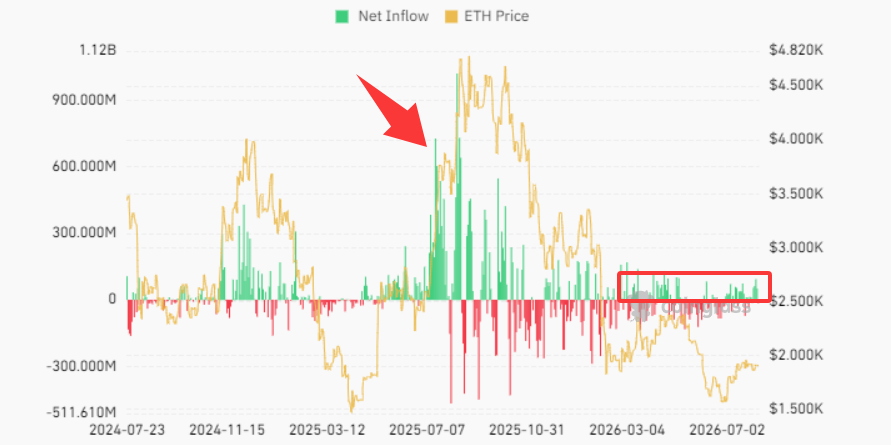 U.S. spot ETF fund flows, Source: CoinGlass
Ethereum Technical Analysis: Short-Term Volatility Expected With Medium- to Long-Term Bullish Outlook
Since July 14, when the ETH price broke out and stabilized above $1,800 with a large bullish candlestick, it broke out of its consolidation range of $1,500 to $1,800 and entered a higher-level consolidation phase. Currently, it is fluctuating within a narrow range of $1,800 to $2,000. If the price can break out and hold above $2,000 with a daily solid candlestick on high volume, it will confirm the formation of a low-level double bottom (W-bottom) or an ascending bottom, with a target to challenge the $2,500 resistance zone by the end of the year.
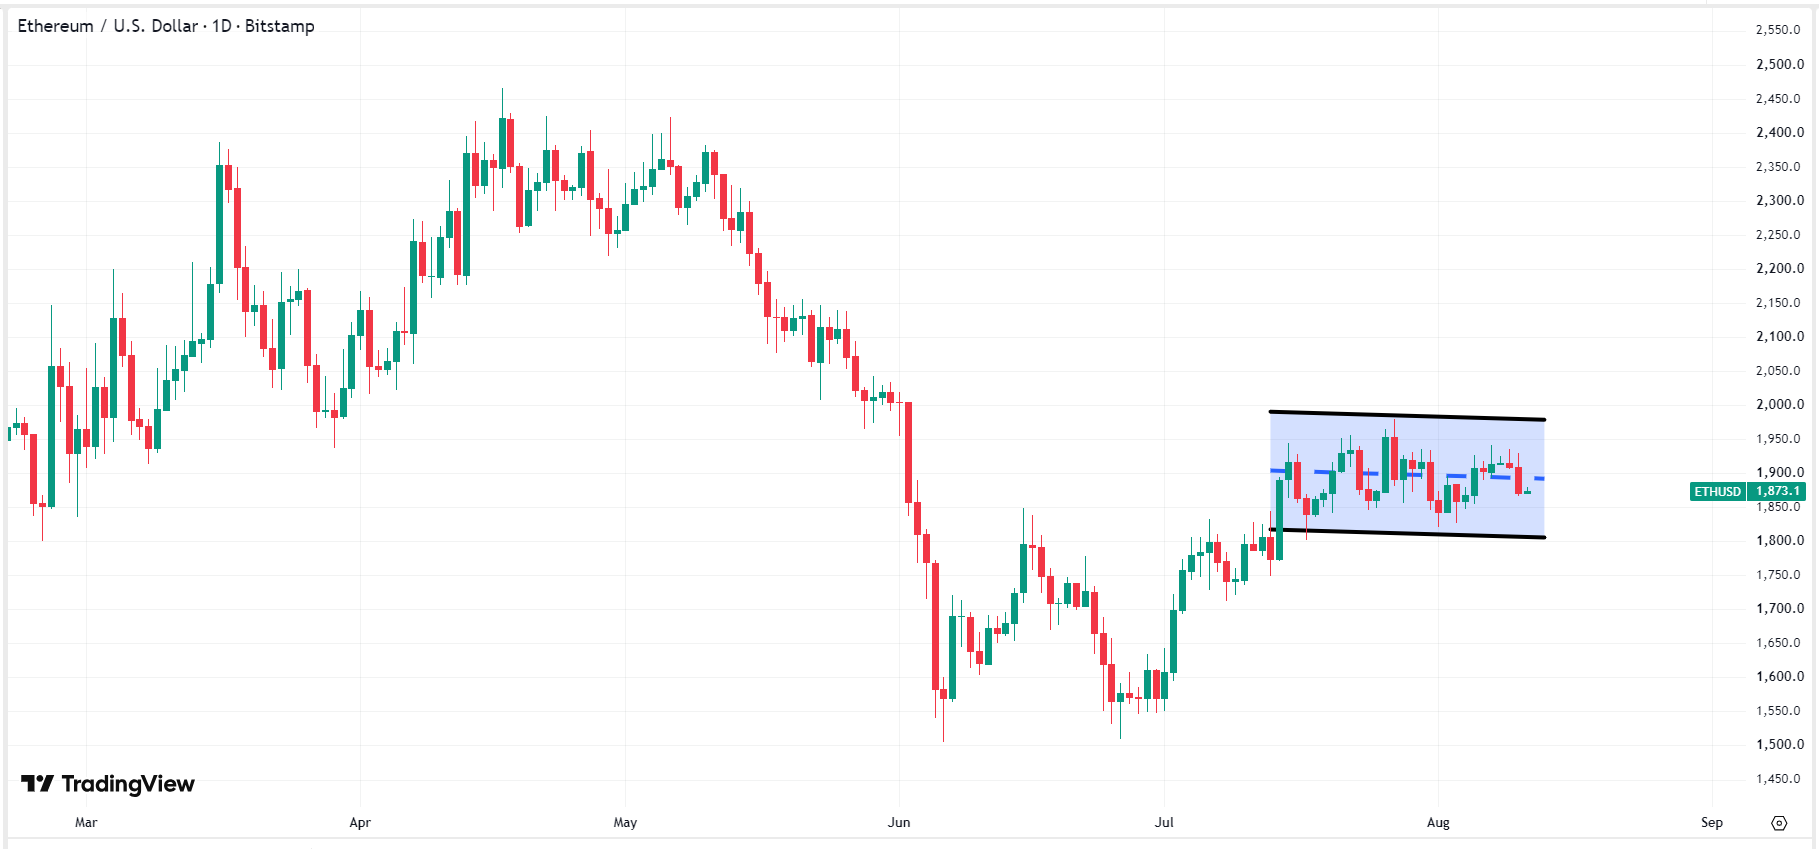 ETH price chart, Source: TradingView
However, if ETH fails to hold $1,800 in the short term, the price may break below the ascending trendline and seek support near the previous low of $1,500. As long as it does not fall below this level, the medium-to-long-term bottoming structure remains valid.
This content was translated using AI and reviewed for clarity. It is for informational purposes only.
Recommended Articles











Comments (0)
Click the $ button, enter the symbol, and select to link a stock, ETF, or other ticker.