


US September PPI Far Exceeds Expectations, Heating Inflation and Hitting Markets as Bitcoin Retests $80,000



AI Podcast


On October 15, the U.S. Bureau of Labor Statistics released September 2026 PPI data showing inflation rebounding significantly above expectations, with headline YoY at 6.3%. Combined with a hotter CPI, this macro inflation surprise triggered a derivatives leverage liquidation. Consequently, Bitcoin fell, retesting the critical $80,000 defense line at $80,781. While short-term sentiment is pessimistic, long-term holders show no large-scale capitulation. If $80,000 holds, it offers a Q4 dollar-cost averaging opportunity; however, a decisive breakdown risks further downside toward the $74,000–$75,000 support range.

TradingKey - US September PPI data heats up unexpectedly, Bitcoin slides as key $80,000 defense line comes under pressure.
On October 15, the U.S. Bureau of Labor Statistics (BLS) officially released the latest September 2026 Producer Price Index (PPI) data. Bitcoin (BTC) price came under pressure, retesting the $80,000 mark and trading at $80,781.
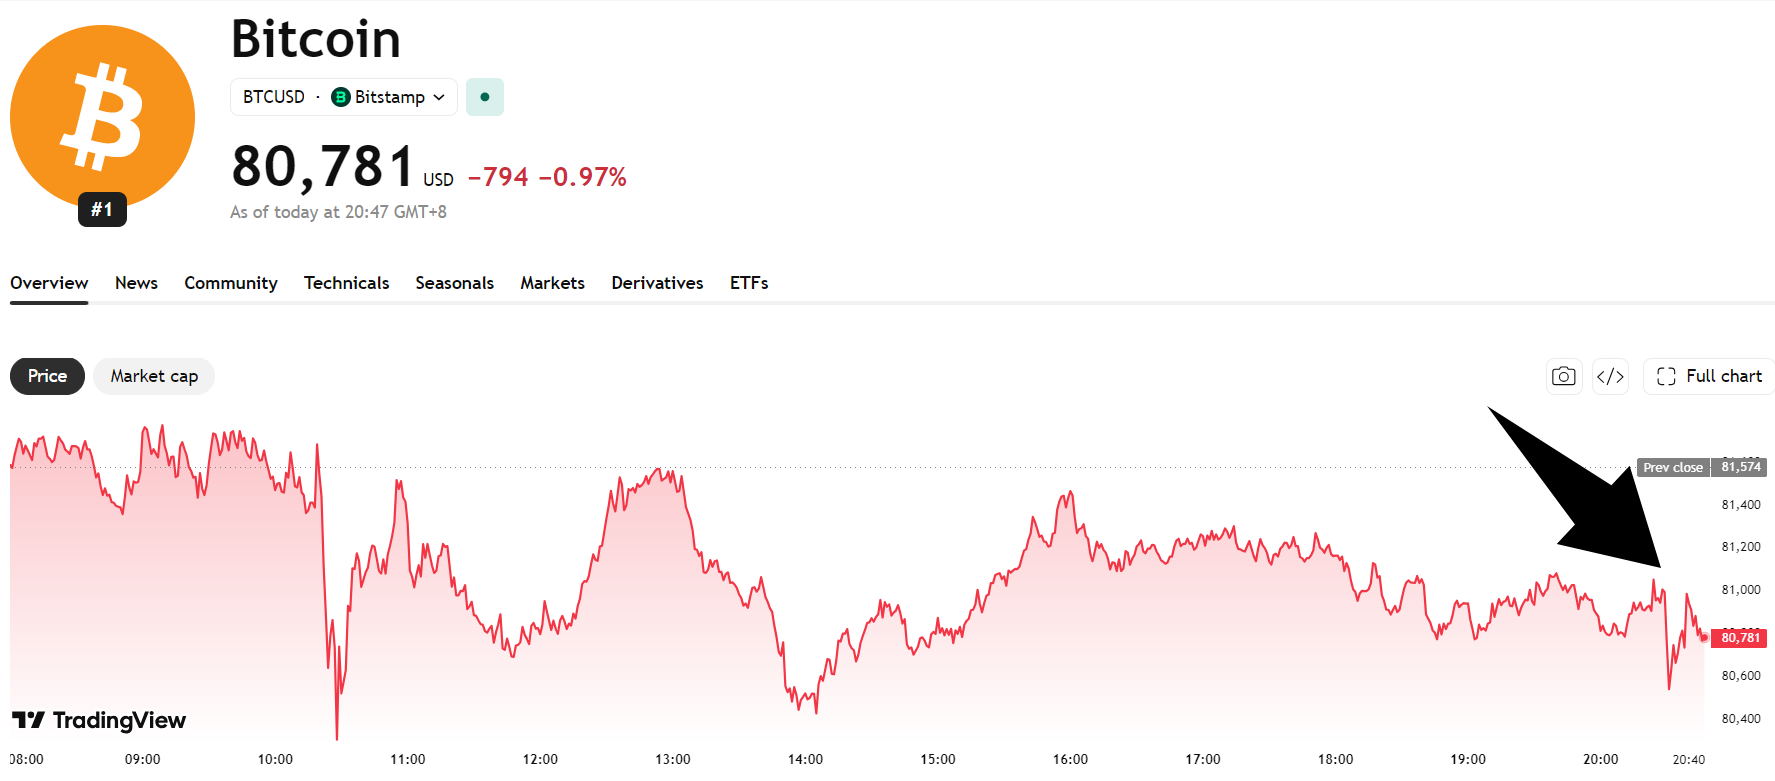 Bitcoin price chart, Source: TradingView
Following yesterday's release of the CPI showing YoY growth rising to 3.7%, the PPI—a leading upstream inflation indicator—rebounded dramatically and significantly above expectations, confirming that corporate production cost pressures are accelerating down the supply chain. Details are as follows:
Inflation Indicator (PPI) | Actual Data | Wall Street Estimate | August Prior |
Headline PPI MoM | +1.3% | +0.5% – +0.6% | +0.4% |
Headline PPI YoY | 6.3% | 5.3% | 5.4% |
Core PPI MoM | +0.5% – +0.6% | +0.3% | +0.2% |
Core PPI YoY | 5.0% | 4.4% | 4.6% |
This double blow of both PPI and CPI exceeding expectations represents a major market liquidation of derivatives leverage triggered by a macro inflation surprise. Although short-term sentiment is extremely pessimistic, long-term Bitcoin holders' on-chain positions have not seen large-scale capitulation, and Bitcoin's price has not yet broken below the key $80,000 level.
Looking ahead, if BTC shows right-side bullish reversal signals near $80,000—such as declining volume bottoming or lower shadow engulfing patterns—it will provide an attractive window for dollar-cost averaging into Q4 positions. However, if a second wave of panic selling causes a decisive break below $80,000, it could seek support lower in the $74,000–$75,000 range.
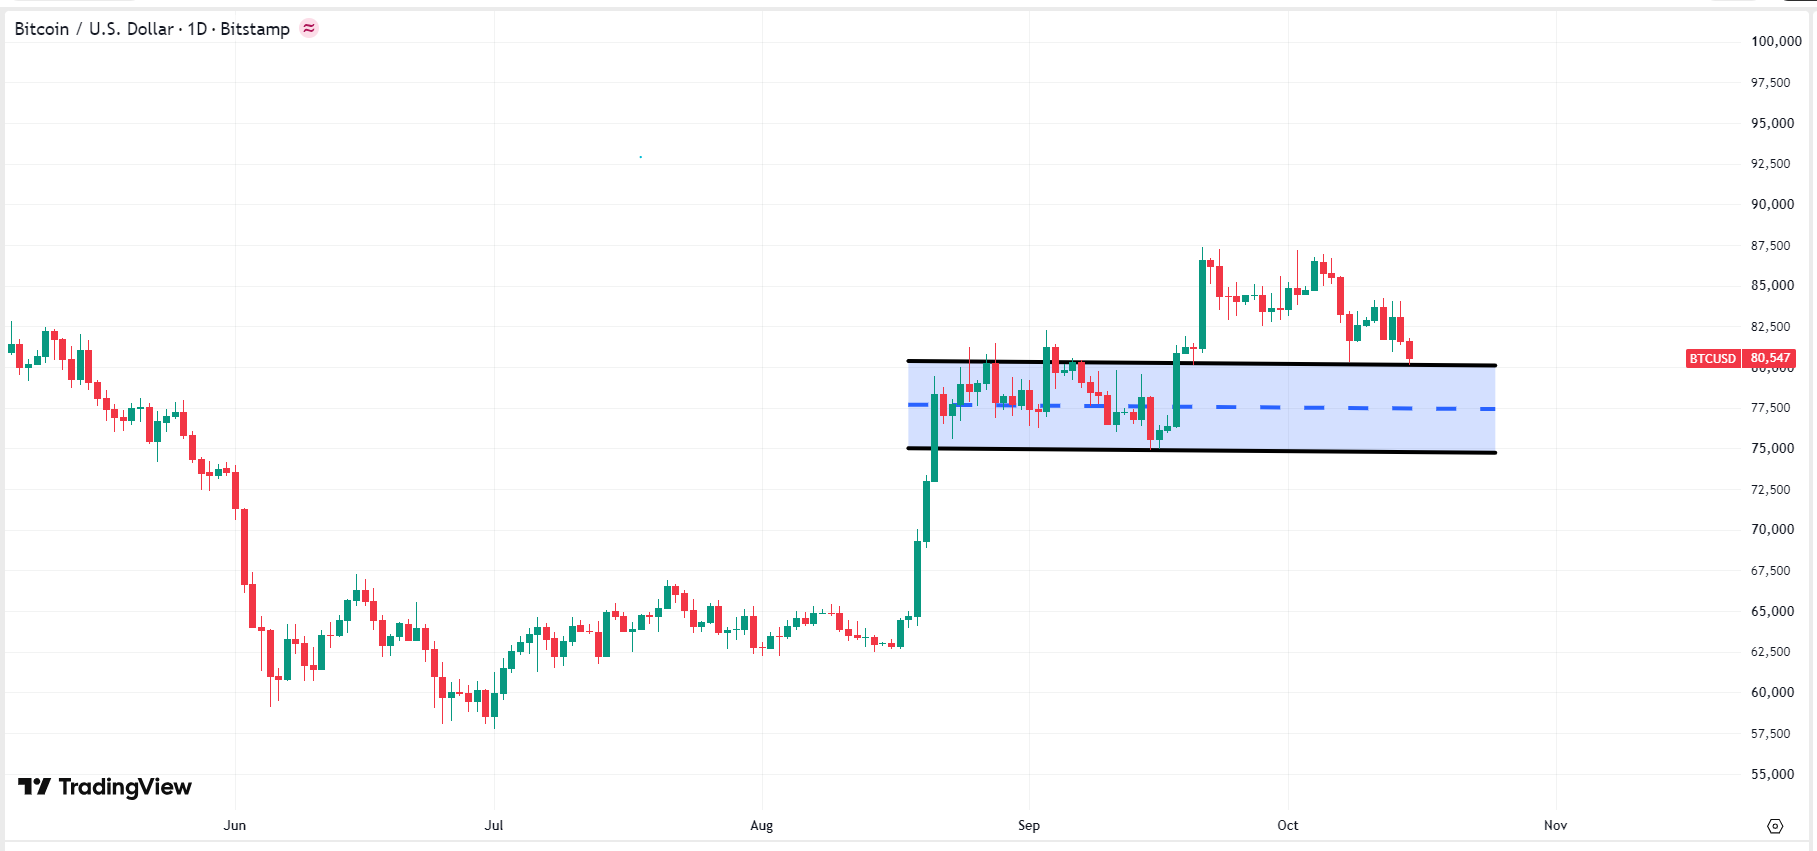 Bitcoin price chart, Source: TradingView
This content was translated using AI and reviewed for clarity. It is for informational purposes only.
Recommended Articles












Comments (0)
Click the $ button, enter the symbol, and select to link a stock, ETF, or other ticker.