


Bitcoin Price Prediction: Tops $72,000 to Hit Highest Since June Amid US Treasury Long-Bond Buybacks and Short Squeeze; Can the Rally Continue?



AI Podcast


On August 20, Eastern Time, Bitcoin surged past $72,000, driven by U.S. Treasury buybacks that eased long-term yields, alongside massive short liquidations exceeding $3 billion and favorable regulatory expectations. This breakout shifted Bitcoin's technical structure to a bullish recovery, reclaiming major moving averages and the 0.5 Fibonacci level. However, sustainability depends on overcoming core overhead resistance at the 0.618 Fibonacci level ($73,227.30). Without sustained spot capital and ETF inflows, this short-squeeze-driven rally risks transitioning into high-volatility consolidation, with primary support anchored at $70,265.89.

TradingKey - On August 20, Eastern Time, Bitcoin (BTCUSD) extended its gains, briefly breaking above $72,000 to touch its highest level since early June. Bitcoin, which had long hovered around $60,000, staged a rapid surge within a short period as market risk appetite clearly recovered.
One of the macroeconomic catalysts for this rally came from the U.S. Department of the Treasury stepping up its buybacks of long-term Treasuries. The U.S. Treasury announced on August 19 that over the coming months, it will at least double the scale of liquidity-support buyback operations for 10- to 30-year Treasuries, raising the maximum limit per operation from $2 billion to at least $4 billion, with implementation scheduled to begin on September 9.
This move eased upward pressure on long-end U.S. Treasury yields. Previously, an expanding U.S. fiscal deficit and increased financing demand from tech companies to build AI data centers had driven long-term borrowing costs higher. As long-term Treasury yields and the U.S. dollar weakened, valuation and liquidity environments for risk assets improved, providing support for high-volatility assets such as Bitcoin.
Pedro Fontes, a research analyst at Brazilian crypto exchange Mercado Bitcoin, pointed out that the current macroeconomic environment strengthens the allocation rationale for Bitcoin. He stated that if the world's largest debt market requires external intervention to operate stably, demand for assets characterized by scarcity, predictability, and independence from public debt expansion logic will grow accordingly.
However, attributing this rally entirely to the expansion of Treasury buybacks would be inaccurate. More direct driving forces included the concentrated liquidation of massive short positions accumulated in the crypto market, as well as improving expectations regarding U.S. digital asset regulation.
According to CoinGlass data, total liquidations across the network exceeded $3.3 billion over the past 24 hours, with short liquidations reaching $3 billion. As the large-scale short covering concluded, upward momentum driven by passive buying weakened somewhat.
In other words, the Treasury's policy adjustment improved macroeconomic risk appetite, while the short squeeze and regulatory expectations jointly amplified Bitcoin's rally.
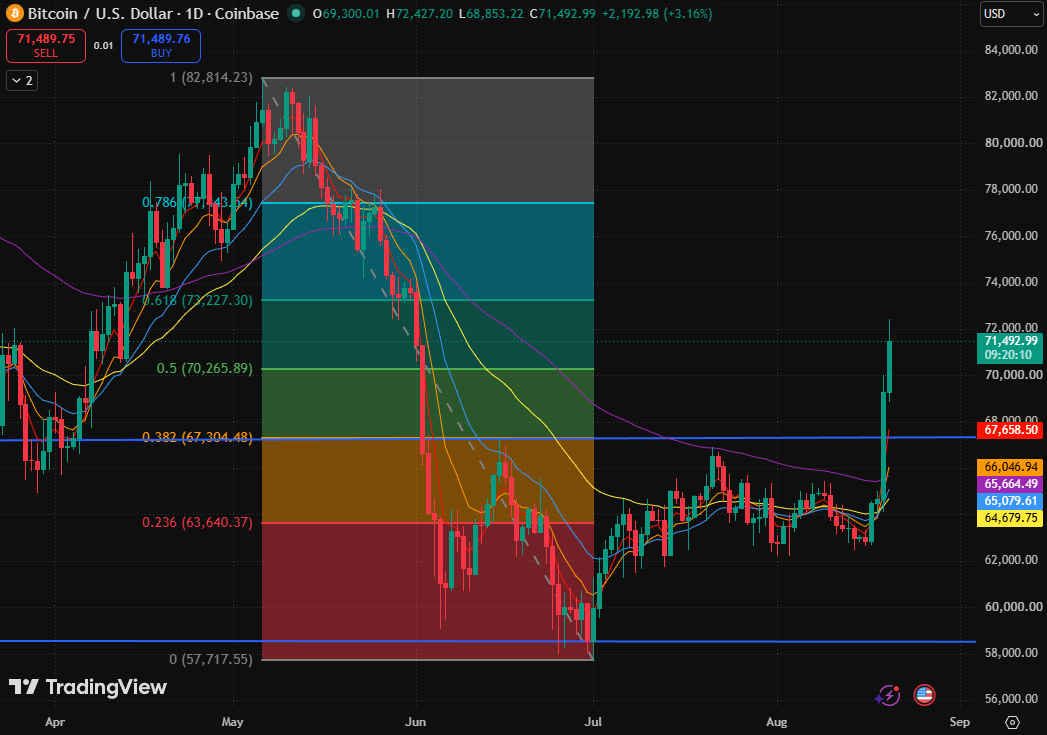
Bitcoin daily chart, Source: TradingView
Bitcoin's price has reclaimed the 5-day, 10-day, 20-day, 40-day, and 80-day moving averages, while recovering the 0.5 Fibonacci retracement level ($70,265.89), with its short-term structure shifting from consolidation to a bullish recovery.
This rally broke out of the sideways consolidation zone in place since June, closing with a long bullish daily candle near the high, which indicates strong buying momentum. Standing above all illustrated moving averages has also converted previous moving average resistance into support below.
However, core resistance remains overhead at the 0.618 Fibonacci retracement level ($73,227.30). This level serves as an important confirmation point for whether this rebound can escalate from a technical recovery to a trend reversal. If it breaks through and holds firmly above $73,227.30, the upside could further extend toward the previous high zone.
If it repeatedly faces resistance at $73,227.30, significant short-term profit-taking may occur. The primary support below is the 0.5 Fibonacci retracement level ($70,265.89). If subsequent pullbacks hold above this level, it will mean the previous breakout level has successfully flipped from resistance to support, maintaining the bullish daily structure.
This move was partly driven by passive buying from concentrated short covering. While a short squeeze aids in breaking out, if spot capital and ETF inflows cannot be sustained, a rapid rise is prone to transitioning into high-volatility consolidation.
This content was translated using AI and reviewed for clarity. It is for informational purposes only.
Recommended Articles











Comments (0)
Click the $ button, enter the symbol, and select to link a stock, ETF, or other ticker.