

Sui Price Forecast: SUI slips below key support, momentum indicator hints deeper correction

- Sui price extends its losses on Tuesday after closing below an ascending trendline, hinting at a change in market structure.
- CryptoQuant data shows that SUI’s Spot Taker CVD is in the red, indicating bearish dominance.
- Technical indicators point to increasing bearish momentum, suggesting further downside correction ahead.
Sui (SUI) continues to trade in red, trading below $3.60 at the time of writing on Tuesday and slipping below a key support level, suggesting a bearish trend ahead. On-chain data shows that SUI’s Spot Taker Cumulative Volume Delta (CVD) is turning red, reflecting bearish dominance. The technical indicators are also pointing to increasing bearish momentum, hinting at a further pullback on the horizon.
Sui’s on-chain data leans bearish
CryptoQuant’s Taker CVD for SUI is negative, and its value has been steadily decreasing since mid-July.
This metric measures the cumulative difference between market buy and sell volumes over three months. When the three-month CVD is positive and increasing, it suggests the Taker Buy Dominant Phase. A negative and decreasing value, as it is currently happening, indicates the Taker Sell Dominant Phase.
 (2)-1755599840549-1755599840562.png)
SUI Spot Taker CVD chart. Source: CryptoQuant
Sui Price Forecast: Momentum indicators show weakness
Sui price closed below an ascending trendline (drawn by connecting multiple lows since mid-June) on Monday. It also closed below its daily support at $3.65 and its 61.8% Fibonacci retracement (drawn from the June low of $2.29 to the July high at $4.44) at $3.62, marking a shift in market structure from bullish to bearish. At the time of writing on Tuesday, it continues to trade down below $3.56.
If SUI continues its correction, it could extend the decline toward its daily support at $3.33. A successful close below this level could extend the losses toward its next daily support at $2.90.
The Relative Strength Index (RSI) edges lower and reads 45 on the daily chart, below its neutral level of 50, indicating bearish momentum. The Moving Average Convergence Divergence (MACD) also showed a bearish crossover on Friday, giving a sell signal and suggesting a downward trend ahead.
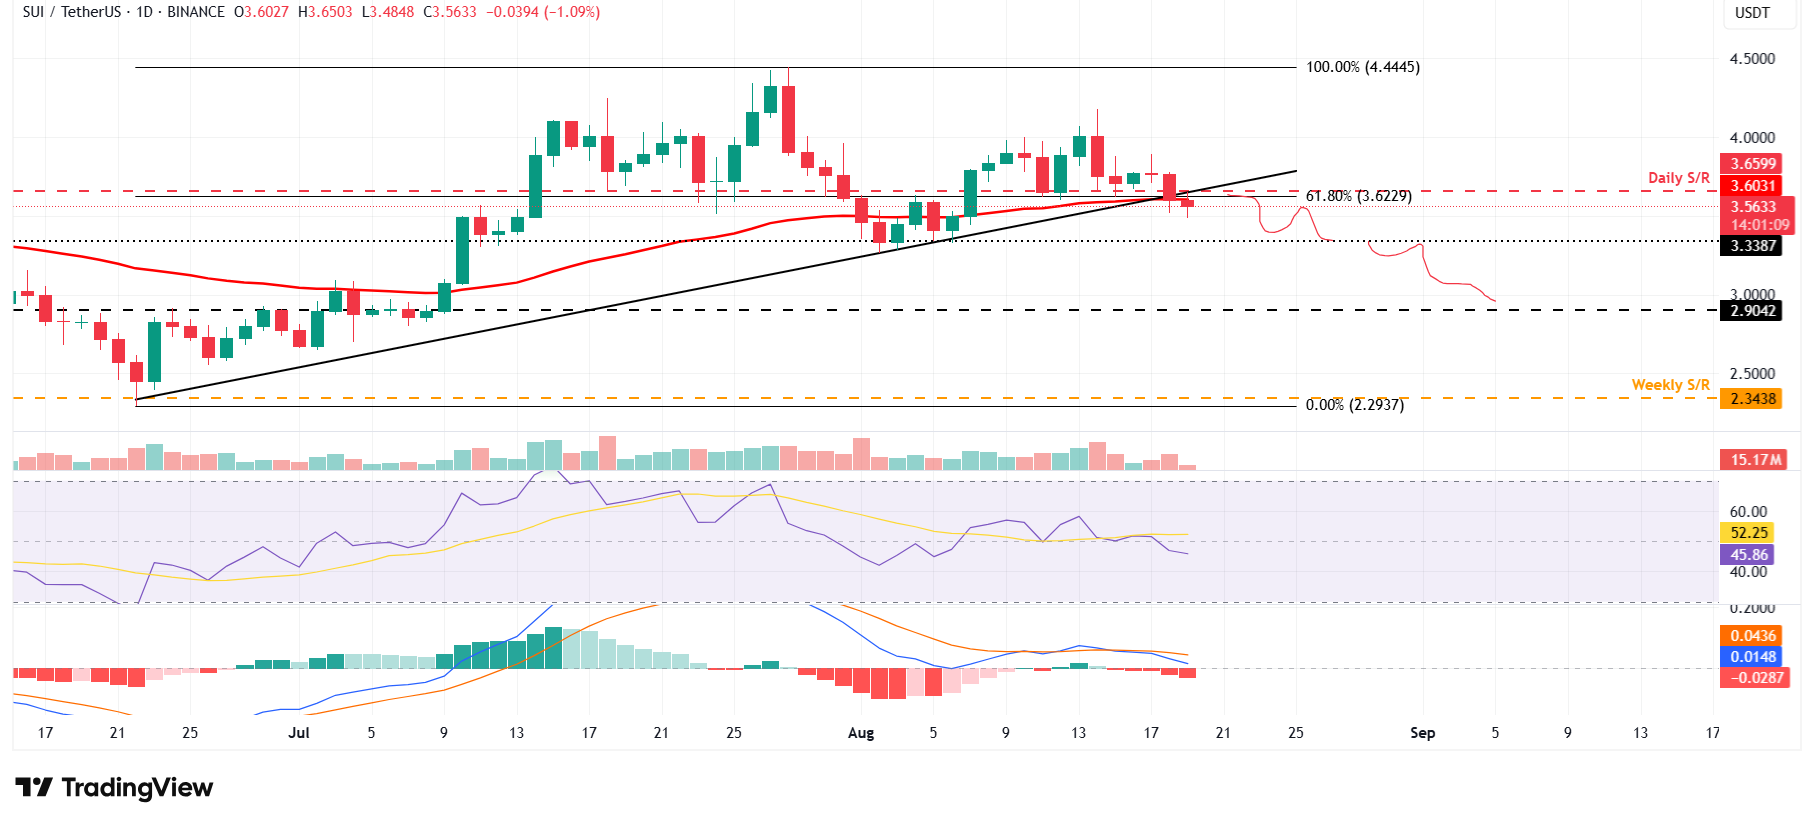
SUI/USDT daily chart
However, if SUI recovers and closes above the daily resistance at $3.65, it could extend the rally toward the August 14 high of $4.18.
Recommended Articles


Comments (0)
Click the $ button, enter the symbol, and select to link a stock, ETF, or other ticker.