


 Discount


TJX Companies Inc Stock (TJX) Opened Up by 8.24% on Nov 18: Key Drivers Unveiled


TJX Companies Inc (TJX) opened up by 8.24%. The Retailers sector is up by 1.24%. The company outperformed the industry. Top 3 stocks by turnover in the sector: Amazon.com Inc (AMZN) up 1.53%; TJX Companies Inc (TJX) up 8.24%; Target Corp (TGT) up 4.49%.
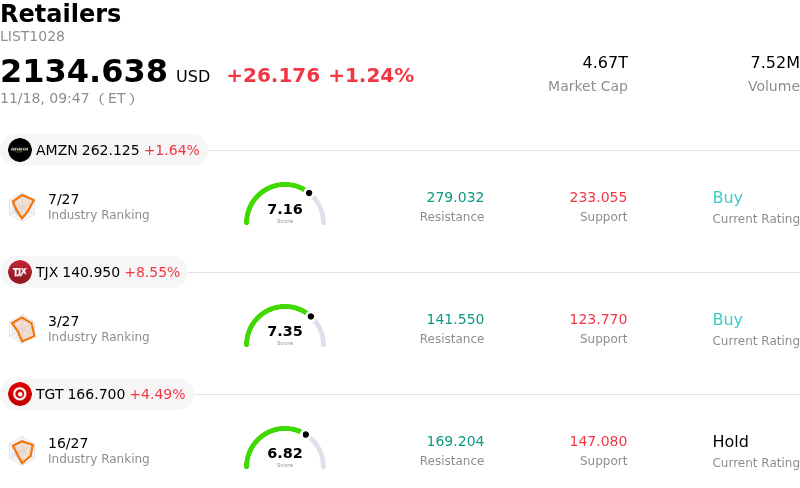
What is driving TJX Companies Inc (TJX)’s stock price up today?
Shares of The TJX Companies moved sharply higher following the release of the off-price retailer’s third-quarter financial results, which surpassed Wall Street expectations on the top line and showcased resilient consumer demand heading into the critical holiday shopping season. Total net sales expanded on the back of solid consolidated comparable store sales growth, driven primarily by higher customer transactions across key divisions including Marmaxx, HomeGoods, and international segments. The retailer demonstrated strong inventory management and execution, allowing it to deliver healthy profitability despite elevated supply chain and freight costs.
The broader macroeconomic environment continues to serve as a catalyst for TJX’s off-price model. As consumers remain budget-conscious amid lingering inflationary pressures and selective discretionary spending, the value proposition offered by TJX’s banners has steadily gained market share from full-price department stores and specialty apparel retailers. The steady influx of bargain-seeking shoppers has supported sustained store traffic, while the company’s flexible purchasing model has enabled buyers to secure high-quality branded merchandise at attractive closeout terms, preserving gross margin stability.
Market sentiment was further bolstered by management’s constructive guidance for the upcoming fourth quarter and full fiscal year. TJX provided an encouraging outlook for both comparable sales growth and operating margins, signaling confidence in consumer engagement throughout the peak holiday period. Additionally, consistent capital return programs through active share repurchases and regular dividend payouts reaffirmed institutional confidence in the balance sheet’s durability and long-term cash flow generation. With strong merchandising execution, robust foot traffic trends, and superior positioning in the retail landscape, institutional investors responded enthusiastically to the company’s ability to outperform retail peers.
Technical Analysis of TJX Companies Inc (TJX)
Technically, TJX Companies Inc (TJX) shows a MACD (12,26,9) value of -1.075, indicating a sell signal. The RSI at 54.643 suggests neutral condition and the Williams %R at 31.674 suggests buy condition. Please monitor closely.
Media Coverage of TJX Companies Inc (TJX)
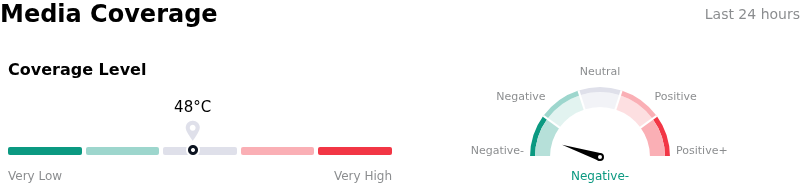
In terms of media coverage, TJX Companies Inc (TJX) shows a coverage score of 48, indicating a moderate level of media attention. The overall market sentiment index is currently in extremely bearish zone.
Fundamental Analysis of TJX Companies Inc (TJX)
TJX Companies Inc (TJX) is in the Retailers industry. Its latest annual revenue is $60.37B, ranking 5 in the industry. The net profit is $5.49B, ranking 3 in the industry. Company Profile
Over the past month, multiple analysts have rated the company as Buy, with an average price target of $169.58, a high of $198.00, and a low of $127.50.
More details about TJX Companies Inc (TJX)
Company Specific Risks:
- Core Marmaxx Growth Deceleration: Comparable sales growth in TJX's flagship Marmaxx banner has decelerated significantly relative to auxiliary divisions, fueling analyst concerns over lost market share in core apparel to off-price competitors such as Ross Stores.
- Margin Compression from Elevated Expansion Capex: Aggressive store footprint expansion toward a 7,500-unit target is pushing capital expenditures up to $2.3 billion, dampening operating margins, compressing return on invested capital, and threatening free cash flow generation by roughly 10%.
- Institutional Target Cuts and Valuation Resistance: A wave of recent Wall Street revisions—including an analyst downgrade to Hold and price target cuts by firms such as Morgan Stanley, UBS, and Baird—highlights growing skepticism that current share price multiples can withstand conservative forward holiday guidance.
- Governance and Reputational Scrutiny Over Tariff Retentions: Public reporting indicating that company banners retained tariff refunds for executive compensation rather than offsetting customer pricing has introduced headline risk and governance scrutiny during an increasingly price-sensitive retail environment.
This article may include AI-generated content that is human-reviewed, which is for reference and general information purposes only and does not constitute investment advice.
Recommended Articles









Comments (0)
Click the $ button, enter the symbol, and select to link a stock, ETF, or other ticker.