


Texas Instruments Inc Stock (TXN) Moved Down by 3.21% on Nov 16: Key Drivers Unveiled


Texas Instruments Inc (TXN) moved down by 3.21%. The Technology Equipment sector is down by 3.07%. The company underperformed the industry. Top 3 stocks by turnover in the sector: NVIDIA Corp (NVDA) down 2.56%; Micron Technology Inc (MU) down 5.98%; Advanced Micro Devices Inc (AMD) down 4.92%.
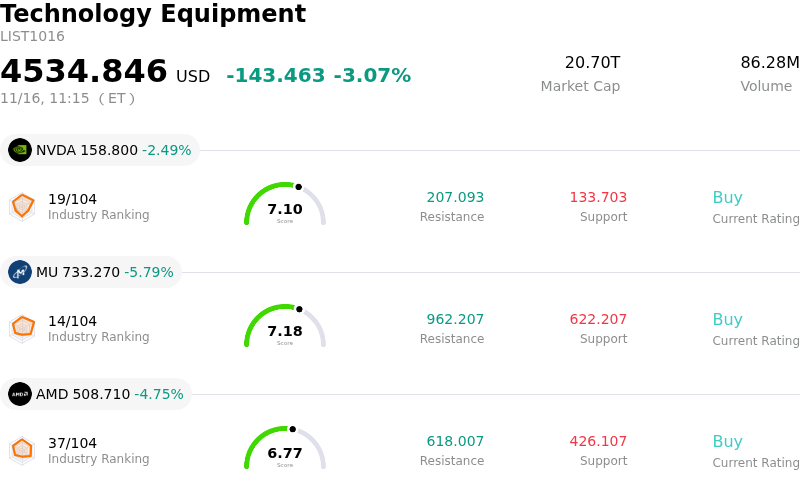
What is driving Texas Instruments Inc (TXN)’s stock price down today?
Texas Instruments experienced notable downward pressure during today's trading session as broad-based semiconductor sentiment deteriorated and investors reassessed the pace of recovery across key end-markets. As a bellwether for the analog and embedded processing industries, the company remains heavily exposed to global industrial and automotive demand. Renewed caution regarding prolonged customer inventory destocking, coupled with sluggish factory automation orders and softer automotive production schedules, continues to weigh heavily on revenue momentum. Investors are growing increasingly sensitive to signs that the anticipated cyclical rebound in traditional mature-node semiconductors is extending further into the horizon rather than staging a sharp recovery.
Compounding these top-line concerns are margin pressures stemming from the company's aggressive, multi-year manufacturing expansion strategy. Texas Instruments has maintained substantial capital expenditure commitments to build out internal 300-millimeter wafer fabrication capacity. While this long-term investment is structurally designed to yield meaningful unit-cost advantages and geopolitical resilience over time, the near-term consequences include elevated underutilization costs and rising depreciation expenses. In an environment of muted volume growth, these fixed overhead charges dilute gross margins and compress free cash flow, leaving the stock vulnerable to valuation contractions when broad risk appetite retreats.
Competitive dynamics in the analog space are also contributing to market skittishness. Rapidly expanding domestic semiconductor capacity in Asia, particularly within mature legacy nodes, has heightened pricing competition for standard analog components. This dynamic threatens to undermine pricing leverage across commoditized product categories, prompting analysts to revisit forward margin assumptions. Furthermore, broader macroeconomic uncertainties, including persistent interest rate headwinds and lingering geopolitical trade frictions, have reinforced a defensive stance among institutional allocators.
From an institutional portfolio perspective, asset managers have increasingly rotated capital toward semiconductor segments with direct exposure to secular artificial intelligence demand, leaving diversified, capital-intensive analog suppliers facing relative outflows. Today's pullback reflects this thematic reallocation alongside elevated volatility across the broader chip complex. Moving forward, institutional investors will be closely monitoring order cancellation rates, channel inventory levels, and management's commentary regarding factory utilization, as stabilization in industrial bookings remains the prerequisite for a durable reversal in share performance.
Technical Analysis of Texas Instruments Inc (TXN)
Technically, Texas Instruments Inc (TXN) shows a MACD (12,26,9) value of -1.121, indicating a neutral signal. The RSI at 49.779 suggests neutral condition and the Williams %R at 51.468 suggests neutral condition. Please monitor closely.
Fundamental Analysis of Texas Instruments Inc (TXN)
Texas Instruments Inc (TXN) is in the Technology Equipment industry. Its latest annual revenue is $17.68B, ranking 14 in the industry. The net profit is $4.97B, ranking 10 in the industry. Company Profile
Over the past month, multiple analysts have rated the company as Buy, with an average price target of $325.89, a high of $400.00, and a low of $188.00.
More details about Texas Instruments Inc (TXN)
Company Specific Risks:
- Valuation Multiple Compression and Institutional De-risking: With shares trading near 40x trailing earnings—significantly above the historical five-year baseline—the stock is facing severe multiple compression and heightened intraday volatility as institutional investors de-risk semiconductor holdings, trim positions, and increase defensive put hedging.
- Gross Margin Dilution from Fab Expansion Outlays: Sustained multi-billion-dollar capital expenditure commitments for 300mm wafer capacity buildouts, compounded by a $13.65 billion debt load and recent multi-billion-dollar notes issuances, introduce substantial fixed depreciation overhead that exerts ongoing downward pressure on gross margins if plant utilization rates falter.
- Pricing Power Headwinds and Component Competition: Institutional analysts are scrutinizing the durability of forward pricing realizations into 2027, citing growing competitive friction in core power management and general-purpose analog lines that threatens to erode unit economics and constrain margin expansion.
- Persistent End-Market Cyclicality and Inventory Digestion: Heavy core revenue exposure to automotive and industrial electronics leaves the business vulnerable to prolonged inventory digestion among enterprise customers and softer manufacturing trends, presenting immediate downside risk to consensus revenue targets.
This article may include AI-generated content that is human-reviewed, which is for reference and general information purposes only and does not constitute investment advice.
Recommended Articles








Comments (0)
Click the $ button, enter the symbol, and select to link a stock, ETF, or other ticker.