


Nebius Group NV Stock (NBIS) Moved Down by 17.24% on Nov 12: Drivers Behind the Movement


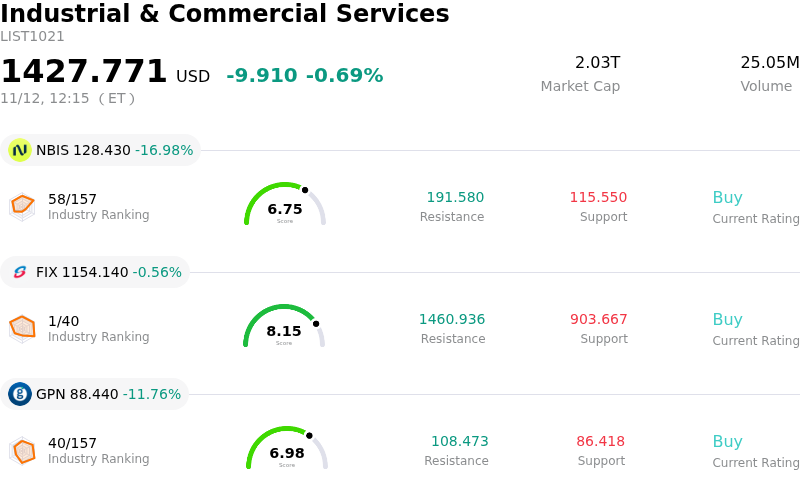
Nebius Group NV (NBIS) moved down by 17.24%. The Industrial & Commercial Services sector is down by 0.69%. The company underperformed the industry. Top 3 stocks by turnover in the sector: Nebius Group NV (NBIS) down 16.83%; Comfort Systems USA Inc (FIX) down 0.56%; Global Payments Inc (GPN) down 11.76%.
What is driving Nebius Group NV (NBIS)’s stock price down today?
Nebius Group experienced a sharp downward repricing following the release of its third-quarter financial results. Although top-line revenue demonstrated rapid annual expansion and surpassed consensus estimates, institutional investors focused intensely on forward execution bottlenecks, deteriorating cost trajectories, and reduced near-term guidance that overshadowed the headline performance.
The primary catalyst for the selloff was management lowering its full-year revenue outlook toward the low end of its prior guidance range. The downward revision was triggered by deployment delays in third-party data center compute capacity, which effectively pushed anticipated cloud revenue recognition into the subsequent fiscal year. Compounding these operational hurdles, leadership postponed its target timeline for reaching its next major annualized revenue run-rate milestone. Investors also expressed apprehension over revenue composition, as a sizable portion of quarterly growth derived from non-recurring technology deployment arrangements rather than sustainable, recurring enterprise cloud consumption.
Simultaneously, heightened capital expenditure projections amplified market anxiety over capital efficiency and financial leverage. Management significantly increased its capital spending expectations for the year to support aggressive infrastructure buildouts, exacerbating free cash flow burn at a time when capital markets are increasingly scrutinizing AI infrastructure balance sheets. With recent convertible debt issuances and credit facility draws already expanding the capital structure, the prospect of prolonged cash burn raises concerns over potential equity dilution and rising debt service costs.
Industry-level dynamics further weighed on sentiment, particularly regarding execution and delivery risk. Reports that key hyperscaler partners have begun tightening oversight on external infrastructure timelines and evaluating project risk profiles have cast uncertainty over the pace of capacity absorption and contract ramp-ups. In an environment where the market demands immediate monetization and clear return on invested capital, Nebius Group's combination of delayed operational milestones, elevated capital requirements, and lowered guidance prompted aggressive institutional derisking.
Technical Analysis of Nebius Group NV (NBIS)
Technically, Nebius Group NV (NBIS) shows a MACD (12,26,9) value of 0.245, indicating a neutral signal. The RSI at 38.422 suggests neutral condition and the Williams %R at 79.435 suggests sell condition. Please monitor closely.
Fundamental Analysis of Nebius Group NV (NBIS)
Nebius Group NV (NBIS) is in the Industrial & Commercial Services industry. Its latest annual revenue is $529.80M, ranking 113 in the industry. The net profit is $82.50M, ranking 74 in the industry. Company Profile
Over the past month, multiple analysts have rated the company as Buy, with an average price target of $289.34, a high of $410.00, and a low of $144.00.
More details about Nebius Group NV (NBIS)
Company Specific Risks:
- Escalating Capital Expenditure Guidance: Nebius sharply increased its capital expenditure projections to approximately $27 billion for fiscal 2026 and $40 billion to $45 billion for 2027, substantially exceeding consensus expectations and triggering acute investor concerns over severe free cash flow deficits and impending external capital raises.
- Fiscal 2026 Revenue Guidance Reduction: Management cut its full-year 2026 revenue expectations to the low end of its previously guided $3.0 billion to $3.4 billion range and postponed its timeline for reaching a $7 billion annualized run rate from December 2026 into early 2027 due to pushed-out revenue recognition.
- Third-Party Infrastructure and Deployment Delays: Disclosures in the Q3 shareholder communication revealed operational bottlenecks and delivery delays across multiple third-party colocation data centers, forcing capacity rollouts into the first half of 2027 and delaying contracted capacity for key client Microsoft until Q2 2027.
- Reliance on Non-Recurring Capacity Revenue: Approximately $325 million of the $980.8 million in reported third-quarter revenue was tied to non-recurring partner-funded capacity agreements rather than recurring high-margin cloud compute subscriptions, exposing the top-line trajectory to contract lumpiness and timing risk.
This article may include AI-generated content that is human-reviewed, which is for reference and general information purposes only and does not constitute investment advice.
Recommended Articles








Comments (0)
Click the $ button, enter the symbol, and select to link a stock, ETF, or other ticker.