


Interactive Brokers Group Inc Stock (IBKR) Moved Up by 6.78% on Nov 11: What Signal Does It Send?


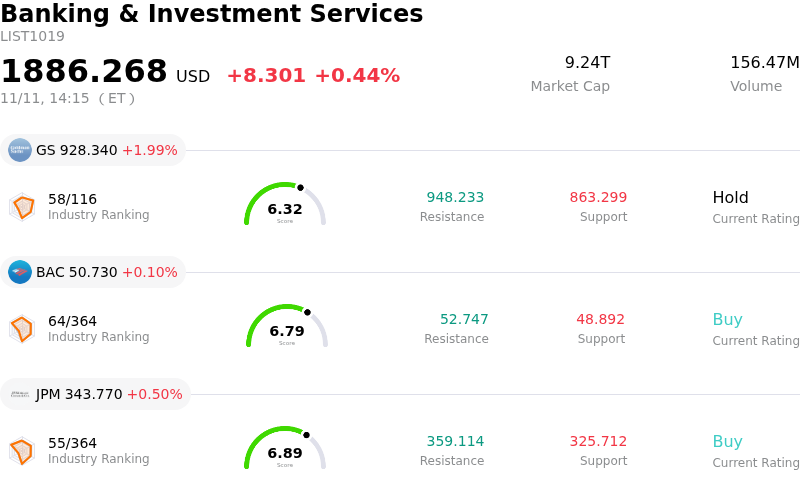
Interactive Brokers Group Inc (IBKR) moved up by 6.78%. The Banking & Investment Services sector is up by 0.44%. The company outperformed the industry. Top 3 stocks by turnover in the sector: Goldman Sachs Group Inc (GS) up 1.99%; Bank of America Corp (BAC) up 0.11%; JPMorgan Chase & Co (JPM) up 0.50%.
What is driving Interactive Brokers Group Inc (IBKR)’s stock price up today?
Interactive Brokers Group advanced notably as a confluence of heightened market-wide trading activity, accelerating client asset growth, and expanding margin balances bolstered investor sentiment across the digital brokerage space. Market participants responded favorably to indications that operational momentum remains exceptionally strong, driven by elevated daily average revenue trades across equities, options, and futures. As institutional and sophisticated retail investors actively adjusted their portfolio positioning amid dynamic macroeconomic conditions, transaction fee generation saw a considerable tailwind.
Beyond transaction volume, the firm continues to benefit from a resilient net interest income profile. Despite evolving expectations surrounding the Federal Reserve policy path, Interactive Brokers retains substantial earning power on client cash balances and margin lending. The platform’s proprietary technology and highly automated clearing infrastructure allow it to maintain an industry-leading operating margin, ensuring that incremental revenue from both commissions and financing activities translates efficiently into bottom-line expansion.
Broader market conditions also played a critical role in fueling buying pressure. A prevailing risk-on environment, paired with robust global liquidity, has catalyzed higher retail and hedge fund engagement, directly lifting customer equity levels and new account acquisitions. Interactive Brokers has maintained an aggressive pace of international account expansion, drawing capital from cross-border investors who seek low-cost, multi-currency access to global exchanges. This structural geographic diversification mitigates localized market downturns and provides a steady influx of fresh capital.
From a valuation and institutional strategy perspective, positive revisions from Wall Street analysts and heightened institutional allocation into financial technology and brokerage leaders further supported the upward trajectory. Investors view the company as a premier beneficiary of structural electronification in trading and steady institutional adoption of its prime brokerage solutions. With sustained operational leverage, a clean balance sheet, and disciplined expense management, the firm remains well-positioned to navigate changing interest rate cycles while capturing outsized market share across global financial markets.
Technical Analysis of Interactive Brokers Group Inc (IBKR)
Technically, Interactive Brokers Group Inc (IBKR) shows a MACD (12,26,9) value of 0.753, indicating a neutral signal. The RSI at 52.559 suggests neutral condition and the Williams %R at 7.585 suggests overbought condition. Please monitor closely.
Fundamental Analysis of Interactive Brokers Group Inc (IBKR)
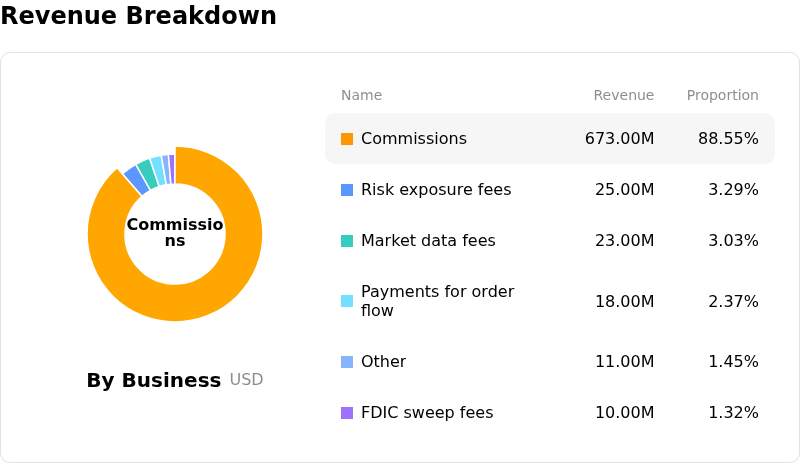
Interactive Brokers Group Inc (IBKR) is in the Banking & Investment Services industry. Its latest annual revenue is $10.00B, ranking 24 in the industry. The net profit is $984.00M, ranking 25 in the industry. Company Profile
Over the past month, multiple analysts have rated the company as Buy, with an average price target of $103.74, a high of $120.00, and a low of $73.19.
More details about Interactive Brokers Group Inc (IBKR)
Company Specific Risks:
- Trading Volume and DARTs Deceleration: Interactive Brokers' latest brokerage metrics revealed a 4% year-over-year contraction in Daily Average Revenue Trades (DARTs) alongside softening trade frequency per account, highlighting that trading engagement is lagging behind account growth and exposing core commission revenues to downside revisions.
- Net Interest Income Sensitivity to Rate Cuts: The company relies on Net Interest Income (NII) for approximately 60% of its total net revenue; persistent expectations of central bank interest rate cuts pose an immediate threat to yields on customer cash balances and margin loan spreads, elevating net interest margin compression risks.
- Pretax Margin Compression from Clearing and Regulatory Costs: Analysts have flagged ongoing margin erosion—with adjusted pretax margins moderating toward 71.5% from prior cyclical highs—driven by elevated execution, clearing, and higher SEC Section 31 regulatory transaction fees that weaken operating leverage.
- Institutional Put Positioning and Insider Selling Pressure: Recent Form 4 filings disclosed director-level share liquidations, which coincided with heavy institutional put-option order flow and technical breakdowns below key moving averages, amplifying intraday volatility and downside momentum.
This article may include AI-generated content that is human-reviewed, which is for reference and general information purposes only and does not constitute investment advice.
Recommended Articles





Comments (0)
Click the $ button, enter the symbol, and select to link a stock, ETF, or other ticker.