


Agnico Eagle Mines Ltd Stock (AEM) Closed Down by 5.15% on Nov 10: What Investors Need To Know


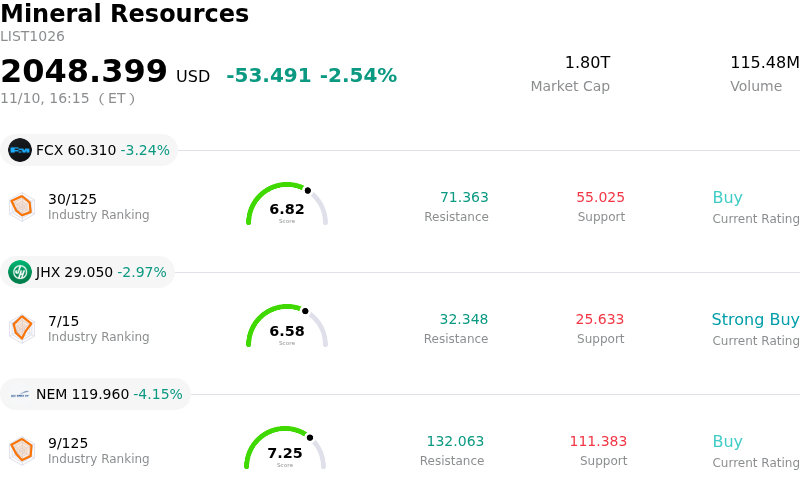
Agnico Eagle Mines Ltd (AEM) closed down by 5.15%. The Mineral Resources sector is down by 2.54%. The company underperformed the industry. Top 3 stocks by turnover in the sector: Freeport-McMoRan Inc (FCX) down 3.24%; James Hardie Industries PLC (JHX) down 2.97%; Newmont Corporation (NEM) down 4.15%.
What is driving Agnico Eagle Mines Ltd (AEM)’s stock price down today?
Agnico Eagle Mines experienced notable downward pressure today, driven primarily by a broader retreat in precious metals markets. A firmer U.S. dollar, paired with an uptick in benchmark Treasury yields, dampened the immediate investment appeal of non-yielding bullion. Because gold mining equities typically exhibit leveraged operational beta relative to physical spot gold, Agnico Eagle bore the brunt of this commodity-level pullback, leading institutional capital to temporarily trim exposure across senior gold producers.
Beyond macro-level commodity headwinds, investor sensitivity toward mine operating costs and all-in sustaining cost structures remains elevated across the precious metals space. Senior miners continue to manage elevated expenses related to labor, consumables, and underground site development. When underlying metal prices soften, the market quickly recalibrates anticipated cash flow margins, amplifying concerns over short-term operating leverage and prompting disciplined portfolio realignments among asset managers seeking to protect earlier performance.
The decline also reflects tactical profit-taking and broader rebalancing within specialized mining funds and exchange-traded products. Following substantial accumulation across the gold mining complex, systematic strategies and momentum-focused accounts often initiate de-risking triggers when key technical support levels in gold futures are tested. This coordinated reduction in long positioning created an intraday liquidity imbalance, exacerbating selling pressure across liquid large-cap industry leaders.
Despite current volatility driven by currency shifts and macro asset rotation, Agnico Eagle continues to maintain one of the strongest balance sheets and lowest operational risk profiles among senior miners, supported by high-quality assets situated predominantly in tier-one mining jurisdictions. Over the immediate horizon, however, share performance will remain tightly tethered to shifts in monetary policy expectations, U.S. dollar momentum, and broader sentiment across global commodities.
Technical Analysis of Agnico Eagle Mines Ltd (AEM)
Technically, Agnico Eagle Mines Ltd (AEM) shows a MACD (12,26,9) value of 5.037, indicating a neutral signal. The RSI at 54.100 suggests neutral condition and the Williams %R at 28.943 suggests buy condition. Please monitor closely.
Fundamental Analysis of Agnico Eagle Mines Ltd (AEM)
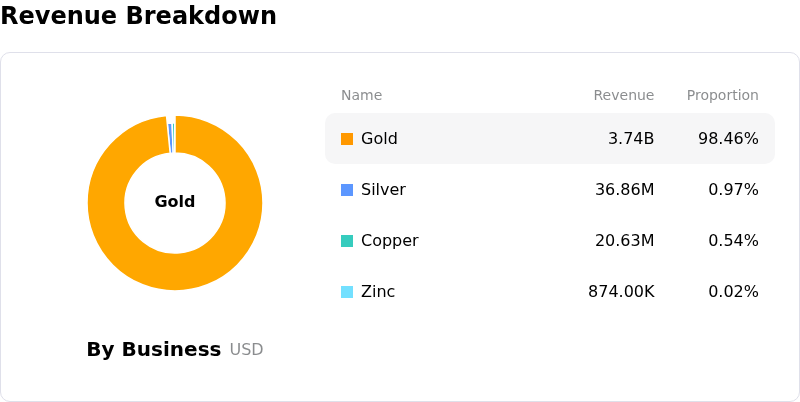
Agnico Eagle Mines Ltd (AEM) is in the Mineral Resources industry. Its latest annual revenue is $11.91B, ranking 19 in the industry. The net profit is $4.46B, ranking 5 in the industry. Company Profile
Over the past month, multiple analysts have rated the company as Buy, with an average price target of $221.21, a high of $355.00, and a low of $94.56.
More details about Agnico Eagle Mines Ltd (AEM)
Company Specific Risks:
- Canadian Malartic Geotechnical Disruption: Wall instability and rock-mass movement at the Canadian Malartic mine's Barnat pit have impaired active mining sequences, directly removing 60,000 to 80,000 ounces from second-half output and threatening extended production shortfalls of up to 150,000 ounces annually through 2028.
- Escalating All-In Sustaining Costs: Third-quarter all-in sustaining costs (AISC) surged to $1,648 per ounce—representing a 24% year-over-year escalation driven by diesel inflation, higher tariffs, and operational cost pressures—tracking full-year unit costs toward the high end of guidance and eroding operating margins.
- Production Guidance Drift Toward Low End: Operational bottlenecks and softer sales volumes have forced full-year gold production estimates toward the lower bound of the company's 3.3 to 3.5 million-ounce guidance range, leaving cash flow highly vulnerable to any intraday pullback in bullion spot prices.
- Institutional Trimming and Valuation Resistance: Recent regulatory filings and institutional updates highlight significant position liquidation, including Pictet Asset Management reducing its stake by 24.9%, alongside price target trims from firms like Barclays and CIBC over concerns regarding an unsustainable valuation premium and Odyssey underground execution risks.
This article may include AI-generated content that is human-reviewed, which is for reference and general information purposes only and does not constitute investment advice.
Recommended Articles







Comments (0)
Click the $ button, enter the symbol, and select to link a stock, ETF, or other ticker.