


AST SpaceMobile Inc Stock (ASTS) Moved Down by 8.63% on Nov 10: A Full Analysis


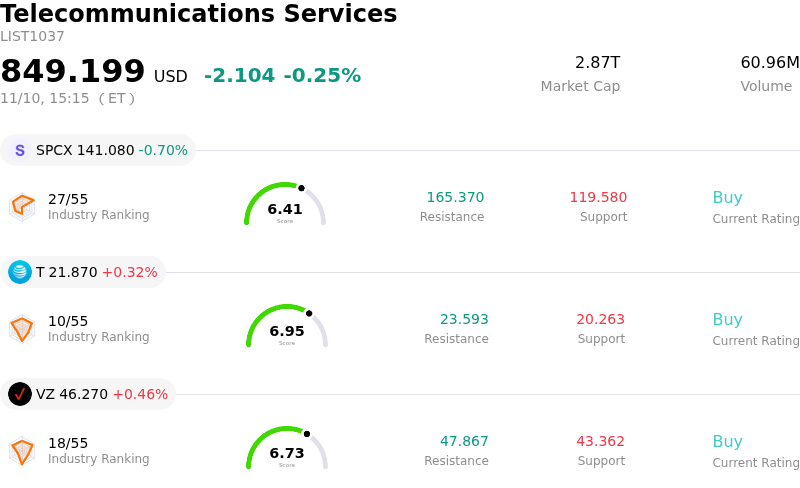
AST SpaceMobile Inc (ASTS) moved down by 8.63%. The Telecommunications Services sector is down by 0.25%. The company underperformed the industry. Top 3 stocks by turnover in the sector: SpaceX (SPCX) down 0.66%; AT&T Inc (T) up 0.32%; Verizon Communications Inc (VZ) up 0.47%.
What is driving AST SpaceMobile Inc (ASTS)’s stock price down today?
AST SpaceMobile faced pronounced downward pressure following its third-quarter earnings release, which delivered a double miss on both top-line revenue and bottom-line profitability. While the company demonstrated year-over-year operational expansion supported by commercial gateway hardware deliveries and government milestones, reported revenue lagged consensus expectations, and net losses widened beyond market projections. This headline disappointment abruptly reversed optimism from recent commercial partnership announcements, refocusing investor attention on near-term execution deficits, elevated operating expenditures, and ongoing operational cash burn.
Compounding the earnings shortfall, major Wall Street analysts swiftly lowered their outlooks, executing steep reductions to price targets while maintaining cautious stances. Research commentary emphasized mounting technological and operational risks, specifically pointing to constellation deployment cadence, delays in commercial availability schedules, and the elevated capital requirements tied to expanding launch capabilities. Furthermore, quarterly regulatory disclosures revealed substantial multi-year capital commitments toward international joint venture initiatives, reigniting institutional concerns regarding balance sheet runway, capital allocation discipline, and the heightened risk of future shareholder dilution.
Broader macroeconomic and sector-level headwinds exacerbated the decline. A hotter-than-anticipated inflation print reinforced expectations of prolonged restrictive monetary policy, dampening risk appetite across the broader equity market. High-beta, capital-intensive space and technology equities experienced an aggressive rotation out of unprofitable growth profiles, leaving shares acutely vulnerable to sustained selling as investors prioritized liquidity and near-term visibility over distant commercial monetization targets.
Technical Analysis of AST SpaceMobile Inc (ASTS)
Technically, AST SpaceMobile Inc (ASTS) shows a MACD (12,26,9) value of 0.013, indicating a neutral signal. The RSI at 36.127 suggests neutral condition and the Williams %R at 64.732 suggests sell condition. Please monitor closely.
Fundamental Analysis of AST SpaceMobile Inc (ASTS)
AST SpaceMobile Inc (ASTS) is in the Telecommunications Services industry. Its latest annual revenue is $70.92M, ranking 61 in the industry. The net profit is $-341.94M, ranking 53 in the industry. Company Profile
Over the past month, multiple analysts have rated the company as Hold, with an average price target of $78.84, a high of $115.00, and a low of $42.50.
More details about AST SpaceMobile Inc (ASTS)
Company Specific Risks:
- Q3 Financial Underperformance and Escalating Operating Expenses: In its Form 8-K filed on November 9, 2026, the company posted Q3 2026 revenue of $42.32 million, falling short of consensus expectations of $46.6 million, while reporting an adjusted net loss of $0.44 per share against the expected loss of $0.40. Total quarterly operating expenses more than doubled year-over-year to $211.03 million, reigniting institutional concerns over uncontrolled cost expansion.
- Heightened Execution and Capital Risk from Rocket Development Program: Management's newly disclosed initiative to design and build an in-house 20-ton reusable rocket ("Backlift") with service targeted for late 2028 has triggered sharp pushback from institutional analysts. Entering the capital-intensive launch vehicle market introduces severe technical execution risk and threatens to drain liquidity away from core satellite broadband deployment.
- Surging Long-Term Leverage and Accelerated Operating Cash Burn: Balance sheet disclosures in the latest quarterly filing revealed long-term debt reached $4.08 billion as of September 30, 2026, up sharply from $2.21 billion at year-end 2025. Furthermore, operating cash burn surged to $314.48 million for the first nine months of the year compared to $136.49 million in the prior-year period, increasing vulnerability to future dilutive capital raises or balance sheet stress.
- Constellation Rollout Vulnerability and Back-Loaded Guidance: Intraday trading saw the stock forfeit previous gains as investors digested operational delays, with nationwide intermittent service activation deferred to late 2026 and commercial beta testing delayed into early 2027. Achieving the reaffirmed FY2026 revenue guidance of $150 million to $200 million is heavily dependent on a steep Q4 ramp and scaling satellite manufacturing to six units per month by December, leaving no room for operational errors.
This article may include AI-generated content that is human-reviewed, which is for reference and general information purposes only and does not constitute investment advice.
Recommended Articles






Comments (0)
Click the $ button, enter the symbol, and select to link a stock, ETF, or other ticker.