


Pershing Square Ord Shs Stock (PS) Moved Down by 11.94% on Nov 10: A Full Analysis


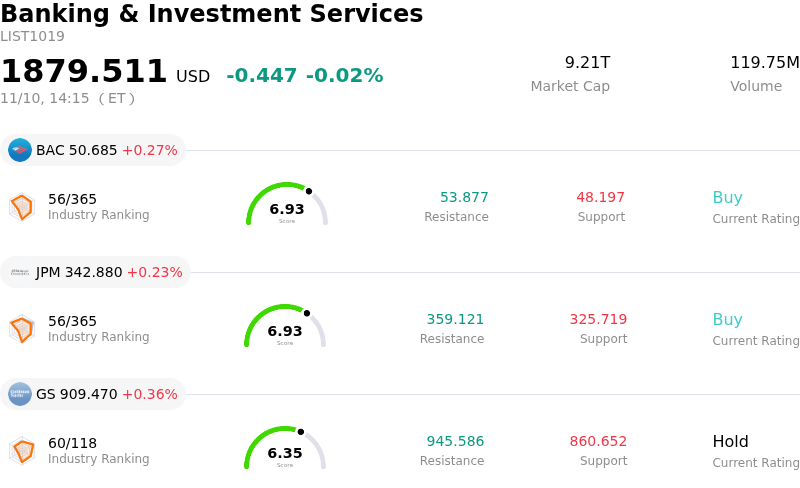
Pershing Square Ord Shs (PS) moved down by 11.94%. The Banking & Investment Services sector is down by 0.02%. The company underperformed the industry. Top 3 stocks by turnover in the sector: Bank of America Corp (BAC) up 0.27%; JPMorgan Chase & Co (JPM) up 0.23%; Goldman Sachs Group Inc (GS) up 0.36%.
What is driving Pershing Square Ord Shs (PS)’s stock price down today?
Pershing Square experienced substantial downward pressure as institutional investors continued to reprice the alternative asset manager following its third-quarter financial results and quarterly regulatory filings. The post-conversion corporate structure has brought heightened scrutiny to the company's baseline profitability, marked by a notable GAAP net loss driven by substantial stock-based compensation, corporate income tax provisions, and the complete absence of performance fees during the period. With top-line management revenues contracting year over year and operational expenses expanding significantly, market participants are increasingly questioning whether recurring fee-related earnings can support the valuation multiple the stock maintained following its initial public offering.
Adding to the selling momentum is an overhang of cautious sell-side sentiment and price target revisions. A growing contingent of Wall Street brokerages has maintained or reiterated cautious ratings, citing limited upside potential and elevated execution risks relative to established alternative asset management peers. Prevailing consensus price targets have clustered well below recent trading levels, prompting institutional asset allocators to trim holdings as valuation premiums compress. With management signaling a preference for long-term capital reinvestment over near-term liquidity support such as aggressive share repurchases, the equity lacked buying support against institutional liquidation.
Broader investor hesitation has also been exacerbated by the concentrated nature of the firm’s underlying investment portfolio and heightened sensitivity to macroeconomic volatility. Strategic shifts within key equity holdings, alongside lingering uncertainty surrounding policy-dependent special situations, have injected execution risk into forward asset valuations. Furthermore, public commentary from leadership warning of distorted equity market dynamics and elevated market leverage has paradoxically reinforced defensive positioning among institutional investors. Faced with elevated quarterly earnings volatility and uncertain performance-fee timing, capital actively rotated away from the newly public manager toward more diversified, cash-generative financial peers.
Technical Analysis of Pershing Square Ord Shs (PS)
Technically, Pershing Square Ord Shs (PS) shows a MACD (12,26,9) value of 0.297, indicating a buy signal. The RSI at 45.143 suggests neutral condition and the Williams %R at 69.716 suggests sell condition. Please monitor closely.
Fundamental Analysis of Pershing Square Ord Shs (PS)
Pershing Square Ord Shs (PS) is in the Banking & Investment Services industry. Its latest annual revenue is $348.77M, ranking 86 in the industry. The net profit is $249.78M, ranking 54 in the industry. Company Profile
Over the past month, multiple analysts have rated the company as Hold, with an average price target of $44.61, a high of $51.00, and a low of $38.00.
More details about Pershing Square Ord Shs (PS)
Company Specific Risks:
- Top-Line Revenue Contraction and Vanishing Performance Fees: Recent Form 10-Q disclosures revealed that third-quarter GAAP revenue dropped 14% year-over-year to $56.6 million, missing Wall Street expectations by over $20 million as performance fees fell to zero. The total absence of incentive fee revenue caused the company to swing from a $155.5 million net profit in the prior-year period to a GAAP net loss of $19.9 million.
- Surging Compensation Overhead and Operating Losses: Operating expenses escalated to $76.7 million during the quarter, driven by a surge in employee compensation and benefits to $70.5 million compared to just $5.7 million in the prior-year period. Driven by $64.8 million in post-IPO stock-based compensation and escalating general and administrative overhead, the firm posted an operating loss of $20.1 million, heightening analyst scrutiny over cost containment.
- Structural Corporate Tax Drag on Distributable Cash Flow: Following its transition from a partnership to a taxable C-corporation, the company absorbed an initial corporate income tax provision of $11.5 million in Q3, creating a permanent structural headwind that reduced distributable earnings by 12% year-over-year to $49.5 million. This permanent tax liability significantly narrows cash flow cushions, leaving dividend coverage tightly squeezed at $0.12 in distributable EPS against the $0.103 per-share quarterly payout.
- High Portfolio Concentration and Mark-to-Market Valuation Declines: Non-operating investment income collapsed from $138.1 million in Q3 2025 to $14.8 million, highlighting the vulnerability of the firm's concentrated investment model. Unhedged portfolio holdings face severe downside, with core stakes in Fannie Mae and Freddie Mac remaining down roughly 60% year-to-date due to ongoing conservatorship delays and unrealized losses on PSUS shares dragging on balance sheet equity.
This article may include AI-generated content that is human-reviewed, which is for reference and general information purposes only and does not constitute investment advice.
Recommended Articles






Comments (0)
Click the $ button, enter the symbol, and select to link a stock, ETF, or other ticker.