


Goldman Sachs Group Inc Stock (GS) Moved Up by 4.60% on Nov 9: Drivers Behind the Movement


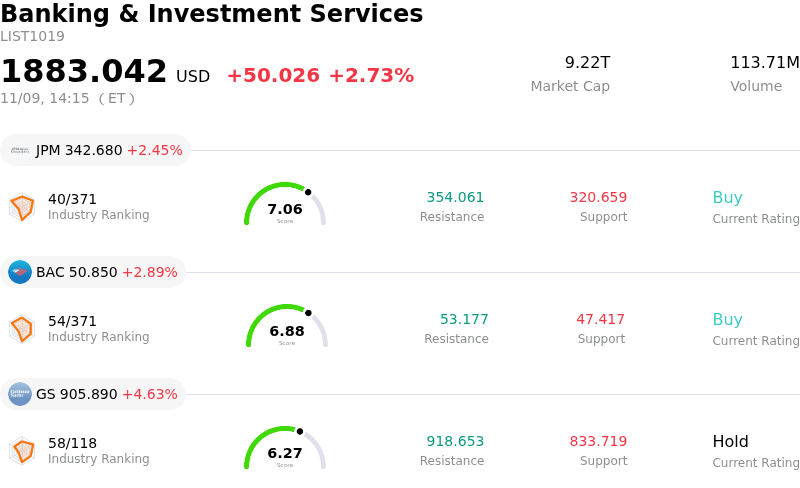
Goldman Sachs Group Inc (GS) moved up by 4.60%. The Banking & Investment Services sector is up by 2.73%. The company outperformed the industry. Top 3 stocks by turnover in the sector: JPMorgan Chase & Co (JPM) up 2.45%; Bank of America Corp (BAC) up 2.89%; Goldman Sachs Group Inc (GS) up 4.63%.
What is driving Goldman Sachs Group Inc (GS)’s stock price up today?
Goldman Sachs experienced strong upward momentum today, driven by an improving macroeconomic climate, a rebound in global dealmaking activity, and supportive industry dynamics across investment banking and trading desks. Market sentiment across the financial sector strengthened markedly as broader capital markets conditions favored large-cap diversified institutions positioned to capture fee-based revenue growth.
A primary catalyst supporting the firm is the continuing acceleration of investment banking pipelines. With corporate confidence rebounding and corporate balance sheets actively being restructured, merger and acquisition advisory mandates along with equity and debt capital market underwriting have seen expanded engagement. Goldman Sachs, maintaining industry-leading market share across global advisory and underwriting, is among the most leveraged beneficiaries of this cyclical recovery in corporate transactions.
Concurrently, institutional trading desks have benefited from heightened market liquidity and healthy trading volumes across fixed income, currencies, commodities, and equities. Active repositioning by institutional asset managers in response to shifting macroeconomic signals has sustained robust commission and client execution activity. The strength in the trading franchise reinforces Goldman Sachs' institutional-focused model, particularly as the firm continues to streamline its operations away from legacy retail lending endeavors.
Investor sentiment has also been bolstered by ongoing execution in wealth and asset management. The strategic pivot toward alternative investments, private credit, and predictable management fee streams has enhanced revenue visibility and structural return on equity. Complementing this operational strength, market expectations surrounding regulatory capital frameworks remain favorable, easing concerns over excessive capital buffer requirements and preserving flexibility for future share repurchases and dividend distributions.
Overall, the firm's advance reflects a confluence of cyclical tailwinds in capital markets and structural improvements in business mix, reinforcing institutional conviction in its intermediate earnings power.
Technical Analysis of Goldman Sachs Group Inc (GS)
Technically, Goldman Sachs Group Inc (GS) shows a MACD (12,26,9) value of 3.654, indicating a neutral signal. The RSI at 50.194 suggests neutral condition and the Williams %R at 39.435 suggests buy condition. Please monitor closely.
Fundamental Analysis of Goldman Sachs Group Inc (GS)
Goldman Sachs Group Inc (GS) is in the Banking & Investment Services industry. Its latest annual revenue is $117.10B, ranking 2 in the industry. The net profit is $16.30B, ranking 1 in the industry. Company Profile
Over the past month, multiple analysts have rated the company as Hold, with an average price target of $1045.75, a high of $1250.00, and a low of $875.00.
More details about Goldman Sachs Group Inc (GS)
Company Specific Risks:
- RWA Expansion and Capital Compression: Sequential increases across Credit, Market, and Operational Risk-Weighted Assets have exerted renewed pressure on standardized CET1 capital ratios, magnifying balance-sheet sensitivity and leaving trading revenues vulnerable to systematic prime brokerage hedge fund deleveraging.
- Federal Consumer Lending Disclosure Lawsuit: Goldman Sachs Bank USA is facing immediate legal and operational headwinds following a new federal class-action filing in the Eastern District of Pennsylvania alleging Truth in Lending Act and Regulation Z disclosure violations, compounding regulatory scrutiny amid the pending transition of its $20 billion credit card portfolio.
- Regulatory Scrutiny on Trading Controls and Disclosures: Persistent enforcement focus on automated trade reporting lapses and supervisory compliance deficiencies—specifically regarding Regulation M notifications and distribution handling—continues to elevate operational risk and compliance overhead across the firm's core market-making business.
- Institutional Target Reductions and Fee Cyclicality: Recent price target cuts from major institutional brokerages down to the $950–$1,000 range have accelerated selling pressure, driven by analyst concerns over the sustainability of investment banking advisory fees and elevated net interest margin sensitivity.
This article may include AI-generated content that is human-reviewed, which is for reference and general information purposes only and does not constitute investment advice.
Recommended Articles











Comments (0)
Click the $ button, enter the symbol, and select to link a stock, ETF, or other ticker.