


RTX Corp Stock (RTX) Moved Up by 3.32% on Nov 9: Drivers Behind the Movement


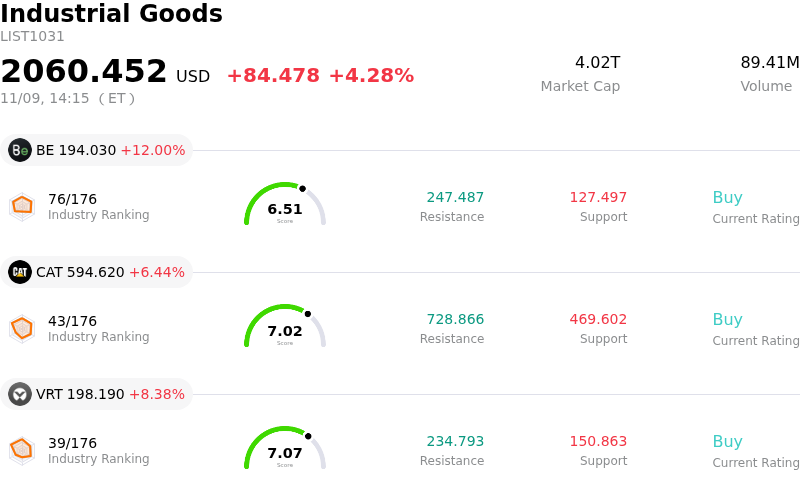
RTX Corp (RTX) moved up by 3.32%. The Industrial Goods sector is up by 4.28%. The company underperformed the industry. Top 3 stocks by turnover in the sector: Bloom Energy Corp (BE) up 12.03%; Caterpillar Inc (CAT) up 6.44%; Vertiv Holdings Co (VRT) up 8.38%.
What is driving RTX Corp (RTX)’s stock price up today?
RTX Corporation demonstrated notable upward momentum as strong institutional demand converged across both defense procurement programs and commercial aerospace operations. Heightened defense appropriations and steady demand for weapon replenishment have created a supportive macro backdrop, reinforcing multi-year revenue visibility for the company's core defense portfolio.
A primary catalyst supporting the advance is sustained order intake across the Raytheon segment. Escalating global security requirements and elevated allied defense spending continue to fuel demand for advanced missile defense systems, counter-drone technologies, and sophisticated sensor suites. International foreign military sales, alongside expanded U.S. Department of Defense contract commitments, have augmented the company's record backlog, providing a defensive cushion against broader macroeconomic volatility and reaffirming long-term cash flow predictability.
Simultaneously, the commercial aerospace divisions, comprising Collins Aerospace and Pratt & Whitney, continue to benefit from robust commercial aviation fundamentals. Global passenger traffic growth and prolonged aircraft utilization rates have translated into strong demand for high-margin aftermarket components, spare parts, and maintenance services. Investor sentiment has also been bolstered by ongoing operational stabilization regarding geared turbofan engine inspections, where progressive execution against fleet management plans has progressively alleviated a long-standing balance sheet overhang.
Constructive analyst sentiment and positive institutional repositioning further magnified the session's gains. The market increasingly views RTX as an attractive compounder capable of balancing defensive military exposure with upside from the commercial aerospace cycle. With steady capital return through dividends, disciplined supply chain management, and margin expansion across business units, the stock attracted broad-based buying from institutional accounts seeking high-quality industrial leadership.
Technical Analysis of RTX Corp (RTX)
Technically, RTX Corp (RTX) shows a MACD (12,26,9) value of -0.169, indicating a neutral signal. The RSI at 51.793 suggests neutral condition and the Williams %R at 55.208 suggests sell condition. Please monitor closely.
Media Coverage of RTX Corp (RTX)
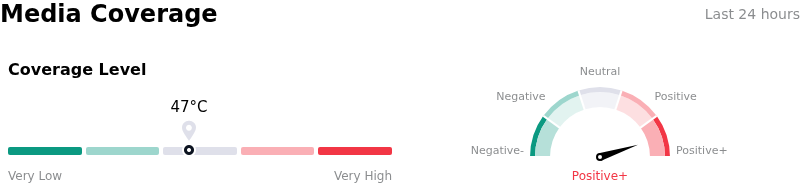
In terms of media coverage, RTX Corp (RTX) shows a coverage score of 47, indicating a moderate level of media attention. The overall market sentiment index is currently in extremely bullish zone.
Fundamental Analysis of RTX Corp (RTX)
RTX Corp (RTX) is in the Industrial Goods industry. Its latest annual revenue is $88.60B, ranking 2 in the industry. The net profit is $6.73B, ranking 2 in the industry. Company Profile
Over the past month, multiple analysts have rated the company as Buy, with an average price target of $224.41, a high of $252.00, and a low of $164.00.
More details about RTX Corp (RTX)
Company Specific Risks:
- Pratt & Whitney GTF Fleet Inspection Overhang: Sustained operational and financial friction surrounding contaminated powdered metal in PW1100G-JM engine turbine discs continues to weigh on the commercial business, creating multi-year shop visit backlogs, costly customer compensation obligations, and persistent cash flow headwinds.
- Fixed-Price Defense Contract Margin Dilution: The Raytheon defense unit remains vulnerable to contract-level margin compression and cost overruns as high-margin legacy production transitions into newer, fixed-price contracts that carry acute execution risks amid persistent aerospace supply-chain and labor cost pressures.
- Mandatory Federal Compliance and Monitor Scrutiny: Following comprehensive multi-agency DOJ, State Department, and SEC settlements exceeding $1.15 billion for defective pricing fraud, export control breaches, and FCPA violations, RTX is burdened by mandatory three-year independent compliance monitor oversight, increasing recurring administrative overhead and regulatory exposure during procurement bids.
- Valuation Sensitivity to Free Cash Flow Variance: With the equity trading near historic highs and its post-crisis discount to defense peers largely eliminated, recent analyst downgrades highlight elevated downside sensitivity if working capital swings, airline charge-offs, or engine turnaround delays trigger a shortfall in targeted free cash flow.
This article may include AI-generated content that is human-reviewed, which is for reference and general information purposes only and does not constitute investment advice.
Recommended Articles









Comments (0)
Click the $ button, enter the symbol, and select to link a stock, ETF, or other ticker.