


Texas Instruments Inc Stock (TXN) Moved Up by 5.48% on Nov 9: Drivers Behind the Movement


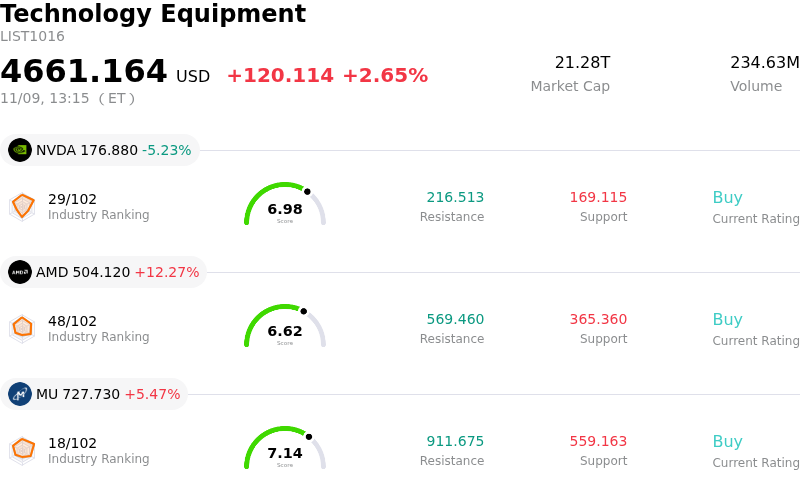
Texas Instruments Inc (TXN) moved up by 5.48%. The Technology Equipment sector is up by 2.65%. The company outperformed the industry. Top 3 stocks by turnover in the sector: NVIDIA Corp (NVDA) down 5.30%; Advanced Micro Devices Inc (AMD) up 12.27%; Micron Technology Inc (MU) up 5.54%.
What is driving Texas Instruments Inc (TXN)’s stock price up today?
Shares of Texas Instruments experienced pronounced upward momentum alongside elevated intraday volatility as institutional buyers stepped in following recent sector-wide pullbacks. Market participants increasingly refocused on the company’s accelerating cyclical recovery across analog and embedded processing, underpinned by strong quarterly operating performance, expanding margins, and optimistic guidance across core end markets.
A primary catalyst for the rebound is the broad-based recovery in the industrial and automotive sectors, complemented by rapidly growing demand for power-management and signal-chain components in artificial intelligence data center infrastructure. Texas Instruments’ strategic multi-year investment in 300-millimeter wafer manufacturing has begun delivering substantial operating leverage, enhancing cost efficiencies and driving gross margin expansion as factory utilization rates climb. This structural cost advantage allows the company to outmaneuver competitors while maintaining disciplined pricing, creating a significant runway for cash flow growth.
Institutional sentiment has also been reinforced by favorable capital allocation trends and sustained analyst support. The company's commitment to returning excess capital, evidenced by its increased quarterly dividend payout and robust free cash flow conversion, has spurred renewed accumulation from dividend-growth and quality-focused funds. Recent ETF inflows and upward revisions to forward earnings estimates from several research desks provided technical support near key moving averages, prompting short-covering and aggressive dip-buying after early-month profit-taking.
Looking ahead, Texas Instruments remains uniquely positioned to benefit from secular silicon content increases across electric vehicles, factory robotics, and next-generation power delivery architectures. However, institutional investors must carefully monitor elevated valuation multiples and potential headwinds from uneven consumer electronics demand or geopolitical export restrictions. In the short term, the company’s superior cash generation, domestic manufacturing footprint, and market share gains in power management continue to drive strong institutional demand.
Technical Analysis of Texas Instruments Inc (TXN)
Technically, Texas Instruments Inc (TXN) shows a MACD (12,26,9) value of -3.567, indicating a neutral signal. The RSI at 51.796 suggests neutral condition and the Williams %R at 53.296 suggests neutral condition. Please monitor closely.
Fundamental Analysis of Texas Instruments Inc (TXN)
Texas Instruments Inc (TXN) is in the Technology Equipment industry. Its latest annual revenue is $17.68B, ranking 14 in the industry. The net profit is $4.97B, ranking 10 in the industry. Company Profile
Over the past month, multiple analysts have rated the company as Buy, with an average price target of $325.89, a high of $400.00, and a low of $188.00.
More details about Texas Instruments Inc (TXN)
Company Specific Risks:
- Stretched Valuation and Multiple Compression Vulnerability: Trading at an elevated valuation of approximately 36 times trailing earnings following a steep year-to-date run, the equity faces acute institutional profit-taking and multiple compression, leaving shares vulnerable to severe intraday selling pressure whenever sentiment wavers.
- Balance Sheet Leverage from Debt-Financed M&A: The pricing of $2.0 billion in senior unsecured debt to finance the $7.5 billion acquisition of Silicon Laboratories elevates total balance sheet debt above $13.5 billion, compounding financial leverage and recurring debt-service obligations amid volatile credit conditions.
- M&A Integration and Execution Exposure: Deploying $7.5 billion for Silicon Laboratories exposes Texas Instruments to substantial operational integration hurdles, regulatory friction, and return dilution if demand across target IoT and wireless analog markets underperforms aggressive projections.
- Substantial Capex Commitments and Demand Normalization: Ongoing multi-billion-dollar outlays for 300mm wafer manufacturing buildouts create a rigid fixed-cost profile that risks operating margin erosion if recent customer inventory restocking abates and baseline industrial and automotive end-market demand normalizes.
This article may include AI-generated content that is human-reviewed, which is for reference and general information purposes only and does not constitute investment advice.
Recommended Articles








Comments (0)
Click the $ button, enter the symbol, and select to link a stock, ETF, or other ticker.