


Goldman Sachs Group Inc Stock (GS) Moved Down by 6.07% on Nov 5: What Investors Need To Know


Goldman Sachs Group Inc (GS) moved down by 6.07%. The Banking & Investment Services sector is down by 2.91%. The company underperformed the industry. Top 3 stocks by turnover in the sector: JPMorgan Chase & Co (JPM) down 3.98%; Goldman Sachs Group Inc (GS) down 6.02%; Bank of America Corp (BAC) down 2.98%.
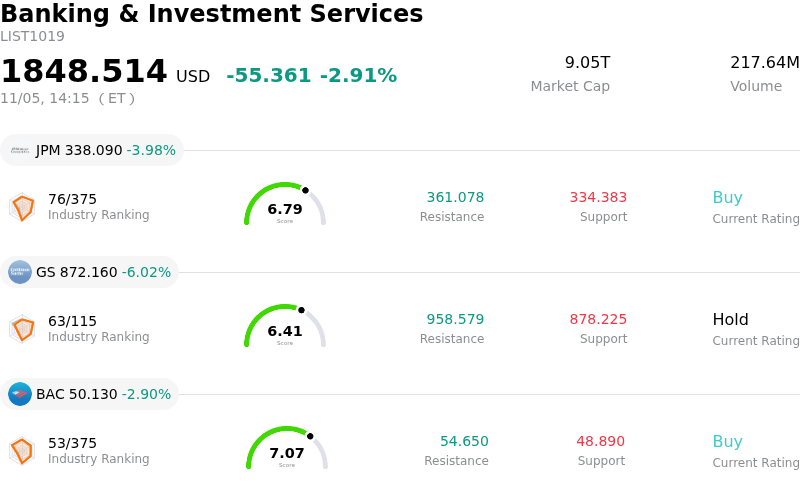
What is driving Goldman Sachs Group Inc (GS)’s stock price down today?
Goldman Sachs faced intense downward pressure during the session, driven by a confluence of macroeconomic headwinds, shifting yield curve expectations, and institutional repositioning across the broader diversified financials sector. As a premier global investment bank heavily leveraged to market activity, corporate dealmaking, and trading desk liquidity, the firm remains particularly sensitive to sudden shifts in investor risk appetite and forward-looking economic indicators.
A primary catalyst behind the pullback stems from heightened macroeconomic uncertainty and shifting expectations surrounding Federal Reserve monetary policy. Volatility in benchmark Treasury yields and a flattening yield curve have clouded the outlook for net interest margins and funding costs across major financial institutions. For Goldman Sachs, persistent uncertainty regarding interest rate trajectories often dampens corporate confidence, directly threatening the timing and execution velocity of M&A advisory pipelines, debt underwriting, and initial public offerings that serve as critical growth engines for the Global Banking and Markets division.
Compounding this cautious macro sentiment, trading dynamics and institutional capital flows reflected a broader de-risking trend. While periods of elevated market volatility can intermittently benefit institutional client services through surging trading volumes in FICC and equities, sudden risk-off moves can also compress principal investment valuations and heighten mark-to-market risks on corporate loan portfolios. The prospect of subdued capital markets activity into the close of the year, alongside elevated client caution, prompted institutional investors to trim exposure to cyclically exposed financial heavyweights in favor of more defensive asset classes.
Additionally, ongoing regulatory scrutiny and evolving capital framework requirements continue to cast an overhang on the investment banking peer group. Investors remain focused on the potential capital allocation constraints and higher reserve requirements tied to regulatory capital updates, which could moderate the pace of future share repurchases and balance sheet flexibility. Operational execution risks related to the ongoing strategic recalibration of consumer and alternative lending activities further amplified investor caution.
Looking ahead, Goldman Sachs requires a stabilization in corporate dealmaking environments, clear visibility into macroeconomic and rate trajectories, and sustained liquidity across primary markets to re-establish upward momentum. Until corporate transaction velocity re-accelerates and risk assets regain institutional footing, the shares are likely to remain susceptible to broader market sentiment and macro-driven volatility.
Technical Analysis of Goldman Sachs Group Inc (GS)
Technically, Goldman Sachs Group Inc (GS) shows a MACD (12,26,9) value of 5.719, indicating a neutral signal. The RSI at 40.848 suggests neutral condition and the Williams %R at 86.718 suggests oversold condition. Please monitor closely.
Fundamental Analysis of Goldman Sachs Group Inc (GS)
Goldman Sachs Group Inc (GS) is in the Banking & Investment Services industry. Its latest annual revenue is $117.10B, ranking 2 in the industry. The net profit is $16.30B, ranking 1 in the industry. Company Profile
Over the past month, multiple analysts have rated the company as Hold, with an average price target of $1045.75, a high of $1250.00, and a low of $875.00.
More details about Goldman Sachs Group Inc (GS)
Company Specific Risks:
- Surging Compensation and Fixed Overhead Pressures: The elevation of Goldman's largest partner class since 2010 (109 promotions) compounds institutional concerns over sticky operational expenses and compensation inflation, especially following a 20% year-over-year jump in operating costs that threatens operating margin stability.
- Institutional Liquidity Contraction Across Trading Desks: Intraday reports from Goldman's equity trading desk reveal an abrupt absence of long-only institutional buyers and aggressive macro de-risking by hedge funds, directly threatening the firm's trading fee momentum after equities trading disproportionately drove recent top-line outperformance.
- Advisory Pipeline Vulnerability in AI and Power Infrastructure: New policy resistance and permitting gridlocks emerging around large-scale data center projects threaten to stall high-margin debt syndication, private credit, and M&A advisory mandates that the bank had positioned as core growth drivers.
- FICC Stagnation and Accelerating Credit-Loss Provisions: Widespread post-earnings price target trims by major brokers highlight acute exposure to flatlining fixed-income, currency, and commodities (FICC) trading revenues, coupled with credit-loss provisions that more than tripled sequentially amid volatile corporate debt conditions.
This article may include AI-generated content that is human-reviewed, which is for reference and general information purposes only and does not constitute investment advice.
Recommended Articles







Comments (0)
Click the $ button, enter the symbol, and select to link a stock, ETF, or other ticker.