


Toyota Motor Corp Stock (TM) Moved Up by 10.29% on Nov 5: Drivers Behind the Movement


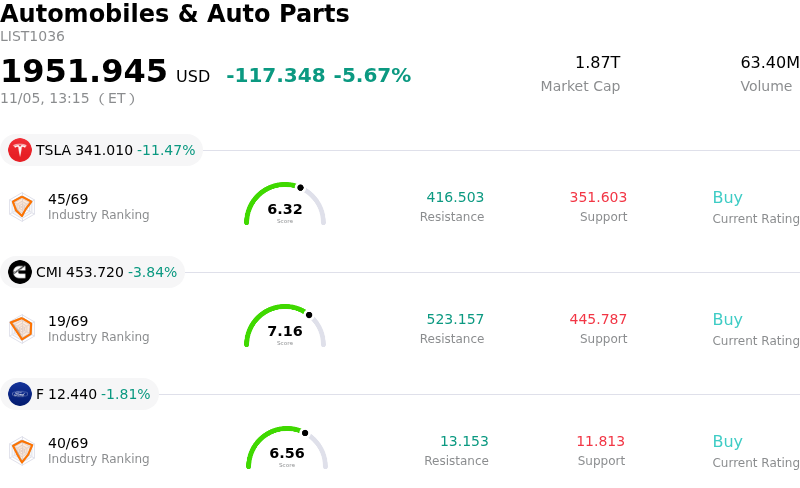
Toyota Motor Corp (TM) moved up by 10.29%. The Automobiles & Auto Parts sector is down by 5.67%. The company outperformed the industry. Top 3 stocks by turnover in the sector: Tesla Inc (TSLA) down 11.51%; Cummins Inc (CMI) down 3.71%; Ford Motor Co (F) down 1.81%.
What is driving Toyota Motor Corp (TM)’s stock price up today?
Toyota Motor Corporation demonstrated exceptional upward momentum, driven primarily by a decisive second-quarter earnings beat alongside an upward revision to its full-year operating profit guidance. The company's quarterly operating results exceeded consensus expectations by a wide margin, marking a meaningful operational inflection and reassuring institutional investors of management's pricing discipline and cost-control capabilities. The raised full-year guidance signaled to the market that near-term profitability remains structurally sound despite broader automotive demand uncertainties.
A primary operational driver of this performance is Toyota's dominant positioning in hybrid powertrains. As the global adoption rate of pure battery electric vehicles continues to normalize due to infrastructure limitations and higher financing costs, consumer demand has rotated aggressively toward hybrid electric vehicles, particularly in North America. Toyota’s multi-pathway powertrain strategy allowed the automaker to capture elevated margins and strong average transaction prices, effectively offsetting localized sales volume pressures in more competitive regions such as mainland China.
Capital allocation policies served as a significant secondary catalyst for institutional accumulation. Management announced an expansion of its shareholder return initiatives, increasing both the interim dividend and the authorization limit for its share repurchase program. This commitment to higher capital distributions reinforces balance sheet strength and provides downside protection. In addition, favorable foreign exchange movements provided a substantial tailwind, as the softer Japanese yen enhanced the translation of overseas revenues and operating earnings.
From a broader market perspective, the stock benefited from a pronounced institutional rotation into high-quality, cash-generative value equities with established pricing power. While investors must continue to monitor lingering risks surrounding potential global trade tariffs, supply chain input costs, and shifting electric vehicle regulations, Toyota's robust hybrid demand, earnings momentum, and amplified capital return profile have solidly reinforced positive institutional sentiment.
Technical Analysis of Toyota Motor Corp (TM)
Technically, Toyota Motor Corp (TM) shows a MACD (12,26,9) value of 3.278, indicating a buy signal. The RSI at 77.740 suggests buy condition and the Williams %R at 4.931 suggests overbought condition. Please monitor closely.
Fundamental Analysis of Toyota Motor Corp (TM)
Toyota Motor Corp (TM) is in the Automobiles & Auto Parts industry. Its latest annual revenue is $336.26B, ranking 1 in the industry. The net profit is $25.53B, ranking 1 in the industry. Company Profile
Over the past month, multiple analysts have rated the company as Buy, with an average price target of $232.50, a high of $239.31, and a low of $230.00.
More details about Toyota Motor Corp (TM)
Company Specific Risks:
- Net Profit Contraction and Analyst Miss: Toyota's fiscal second-quarter net profit plunged 18.5% year-over-year to ¥759.4 billion, missing consensus estimates due to escalating raw material costs, higher operating expenses, and tariff-related burdens.
- Downgraded Vehicle Sales Guidance and Revenue Targets: Management lowered its full-year group vehicle sales forecast from 11.18 million units to 10.99 million units (cutting retail sales expectations by 200,000 units) and trimmed full-year revenue outlook from ¥54.0 trillion to ¥53.5 trillion, highlighting unit-volume weakness across key markets.
- Accelerating Market Share Erosion in China: Quarterly sales dropped 5.2% globally to 2.667 million units, dragged down by a sharp 12% year-over-year contraction in China as cutthroat domestic EV competition and local pricing wars continue to dislodge Toyota's market presence.
- Foreign Exchange Distortion and Geopolitical Disruption Drag: First-half profit resilience was disproportionately subsidized by extreme yen depreciation—which accounted for ¥685 billion in foreign-exchange gains—leaving margins vulnerable to any currency stabilization, compounded by a projected ¥510 billion drag from ongoing supply disruptions tied to the Middle East conflict.
This article may include AI-generated content that is human-reviewed, which is for reference and general information purposes only and does not constitute investment advice.
Recommended Articles







Comments (0)
Click the $ button, enter the symbol, and select to link a stock, ETF, or other ticker.