


Microsoft Corp Stock (MSFT) Moved Down by 3.11% on Nov 5: What Signal Does It Send?


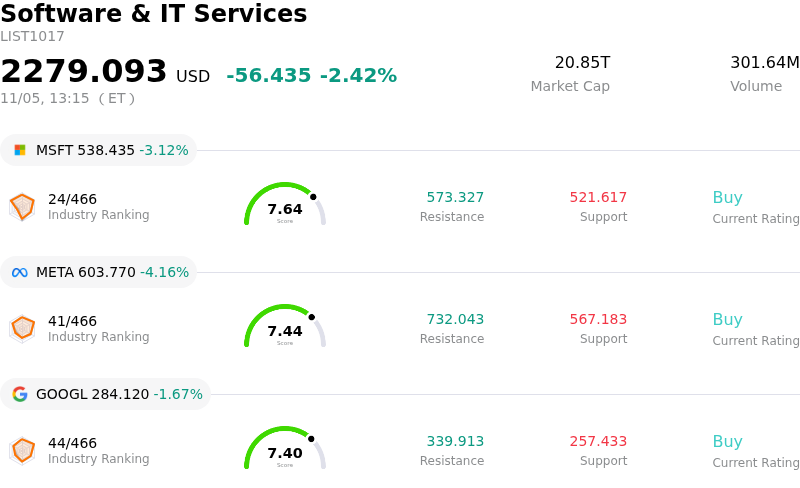
Microsoft Corp (MSFT) moved down by 3.11%. The Software & IT Services sector is down by 2.42%. The company underperformed the industry. Top 3 stocks by turnover in the sector: Microsoft Corp (MSFT) down 3.11%; Meta Platforms Inc (META) down 4.09%; Alphabet Inc Class A (GOOGL) down 1.52%.
What is driving Microsoft Corp (MSFT)’s stock price down today?
Microsoft experienced pronounced downward pressure during today's session as market participants reassessed high-multiple technology valuations against the backdrop of elevated capital expenditure requirements and near-term cloud growth expectations. As institutional investors digest the company's forward operational outlook, sentiment has grown increasingly cautious regarding the timeline required to convert massive artificial intelligence infrastructure investments into corresponding margin expansion.
A primary catalyst for the pullback centers on the rising scrutiny surrounding cloud infrastructure spending. While enterprise demand for generative AI capabilities remains historically robust, ongoing capacity constraints in data centers and elevated depreciation costs are tempering near-term profitability expectations. Institutional desks are increasingly focused on the pace of Azure consumption growth relative to the substantial acceleration in capital outlays for graphics processing units and bespoke data center buildouts. When capital deployment expands at a faster rate than immediate incremental cloud revenue, software multiples often face multiple compression, triggering profit-taking across mega-cap portfolios.
Broader macroeconomic and sector-wide dynamics also compounded the weakness. An uptick in long-term benchmark sovereign yields tightened financial conditions, disproportionately impacting high-duration software equities. As systematic funds and portfolio managers rebalance exposure away from concentrated mega-cap technology holdings toward defensive and cyclical sectors, passive and active outflows exerted persistent intraday selling pressure. Additionally, cautious enterprise IT budget commentary across the broader enterprise software complex has raised concerns that discretionary cloud optimization cycles may linger longer than previously anticipated.
From an institutional perspective, the selloff reflects a tactical valuation recalibration rather than structural deterioration in Microsoft's commercial moat. The company continues to demonstrate industry-leading enterprise penetration through its enterprise productivity suite and cloud ecosystem. However, over the immediate horizon, the stock remains vulnerable to heightened volatility as consensus models adjust operating margin trajectories to account for aggressive infrastructure buildouts. Key indicators for stabilization will include demonstrable acceleration in enterprise AI seat monetization, stabilization in capital expenditure growth rates, and clear evidence of easing capacity constraints across core cloud regions.
Technical Analysis of Microsoft Corp (MSFT)
Technically, Microsoft Corp (MSFT) shows a MACD (12,26,9) value of -0.474, indicating a neutral signal. The RSI at 55.607 suggests neutral condition and the Williams %R at 37.904 suggests buy condition. Please monitor closely.
Media Coverage of Microsoft Corp (MSFT)
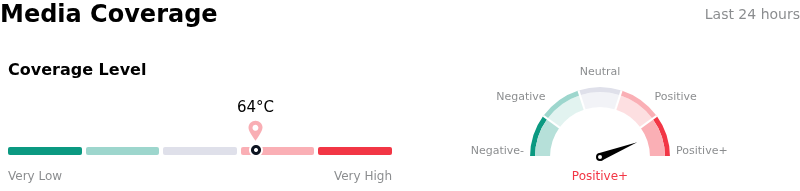
In terms of media coverage, Microsoft Corp (MSFT) shows a coverage score of 64, indicating a high level of media attention. The overall market sentiment index is currently in extremely bullish zone.
Fundamental Analysis of Microsoft Corp (MSFT)
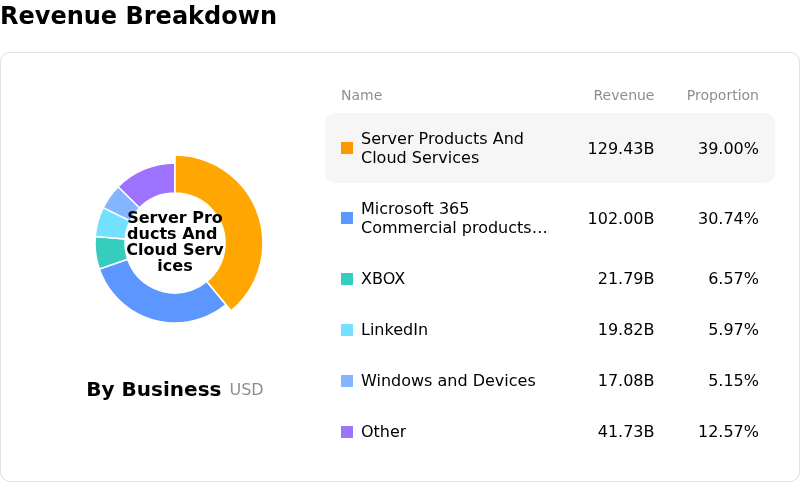
Microsoft Corp (MSFT) is in the Software & IT Services industry. Its latest annual revenue is $331.84B, ranking 3 in the industry. The net profit is $133.75B, ranking 1 in the industry. Company Profile
Over the past month, multiple analysts have rated the company as Buy, with an average price target of $629.11, a high of $870.00, and a low of $440.00.
More details about Microsoft Corp (MSFT)
Company Specific Risks:
- Escalating AI Capital Expenditures and Cash Flow Dilution: With annual capital spending pacing toward $170 billion to sustain generative AI workloads, quarterly infrastructure outlays topping $45 billion have driven a steep decline in free cash flow and fueled analyst downgrades over cloud gross margin compression.
- Balance Sheet Leverage from Mega Debt Issuance: Microsoft's launch of a $25 billion senior notes offering to finance hyperscale data center infrastructure materially increases borrowing obligations and debt-service overhead, underscoring that aggressive AI expansion is straining self-funded capital reserves.
- Physical Infrastructure Delays and Hardware Bottlenecks: Severe supply constraints spanning power access, network facilities, and third-party hardware delivery delays are impeding capacity expansion, restricting Azure from meeting peak compute demand and risking market share loss to rival hyperscalers.
- OpenAI Concentration and Partnership Diversification: With a significant proportion of commercial backlog tied to OpenAI, updated contractual terms allowing OpenAI to route compute workloads to competing cloud platforms such as AWS and Oracle present downside risks to Microsoft's core cloud monetization run-rate.
This article may include AI-generated content that is human-reviewed, which is for reference and general information purposes only and does not constitute investment advice.
Recommended Articles







Comments (0)
Click the $ button, enter the symbol, and select to link a stock, ETF, or other ticker.