


Corning Inc Stock (GLW) Moved Up by 3.93% on Nov 3: What Signal Does It Send?


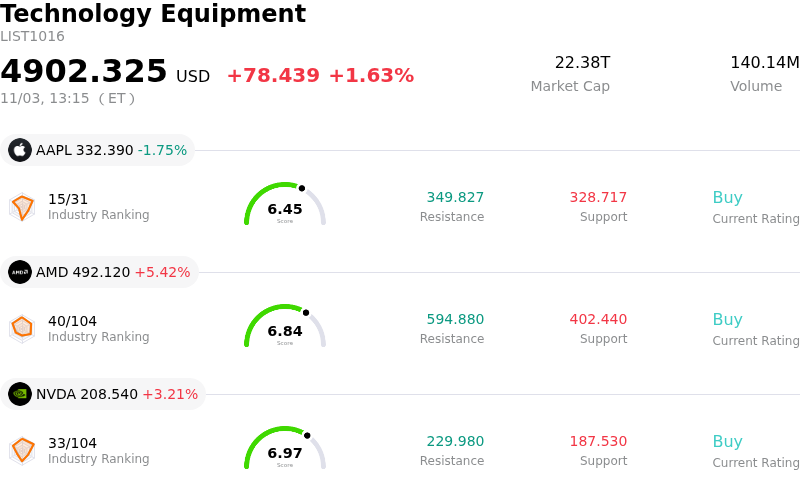
Corning Inc (GLW) moved up by 3.93%. The Technology Equipment sector is up by 1.63%. The company outperformed the industry. Top 3 stocks by turnover in the sector: Apple Inc (AAPL) down 1.70%; Advanced Micro Devices Inc (AMD) up 5.45%; NVIDIA Corp (NVDA) up 3.23%.
What is driving Corning Inc (GLW)’s stock price up today?
Corning Incorporated experienced notable upward momentum driven primarily by sustained investor optimism surrounding its third-quarter financial results and robust multi-year growth outlook. The market has continued to digest the company's strong performance in its Optical Communications division, which has benefited substantially from accelerating demand for generative artificial intelligence infrastructure and data center networking. High-profile strategic partnerships with leading technology firms and hyperscalers have solidified Corning's central role in the global expansion of optical connectivity solutions.
Beyond top-line growth, investor sentiment has been bolstered by operational efficiency gains and margin expansion. Enterprise network demand for optical solutions has seen rapid acceleration, driven by generative AI product adoption. Management's progress under its multi-year Springboard strategic initiative has demonstrated clear operational leverage, with core earnings growing significantly faster than sales. Furthermore, improved pricing environments supported by trade actions have helped stabilize product economics across specialty glass and advanced materials lines.
Wall Street analysts maintain a constructive outlook on the company, pointing to strong free cash flow generation and multi-year supply agreements that provide multi-year revenue visibility. Positive analyst ratings and long-term sales targets have helped attract institutional capital following post-earnings volatility. As artificial intelligence infrastructure spending remains a core capital priority across cloud providers, Corning's expanded manufacturing capacity and co-funded expansion agreements position the firm well to maintain robust profitability.
Technical Analysis of Corning Inc (GLW)
Technically, Corning Inc (GLW) shows a MACD (12,26,9) value of -0.715, indicating a sell signal. The RSI at 41.294 suggests neutral condition and the Williams %R at 57.843 suggests sell condition. Please monitor closely.
Media Coverage of Corning Inc (GLW)
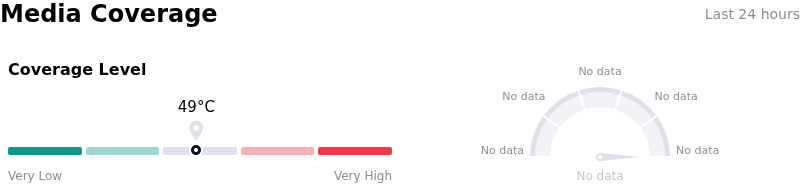
In terms of media coverage, Corning Inc (GLW) shows a coverage score of 49, indicating a moderate level of media attention. The overall market sentiment index is currently in extremely bullish zone.
Fundamental Analysis of Corning Inc (GLW)
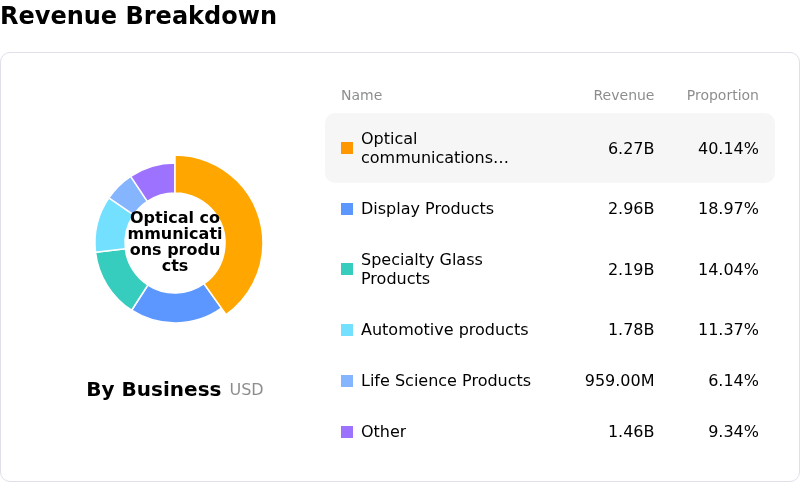
Corning Inc (GLW) is in the Technology Equipment industry. Its latest annual revenue is $15.63B, ranking 7 in the industry. The net profit is $1.60B, ranking 3 in the industry. Company Profile
Over the past month, multiple analysts have rated the company as Buy, with an average price target of $178.32, a high of $220.00, and a low of $132.00.
More details about Corning Inc (GLW)
Company Specific Risks:
- Wall Street Price Target Reductions and Neutral Analyst Sentiment: Major sell-side institutions including Morgan Stanley and JPMorgan Chase lowered their price targets on GLW to $155 and $165 respectively, maintaining neutral ratings over concerns that current share prices already reflect near-term AI optical benefits and require significant operating margin expansion to justify further valuation upside.
- Elevated Valuation Multiple and Profit-Taking Volatility: Trading at a premium valuation of approximately 31.5x forward earnings and a GAAP price-to-earnings ratio near 59x, Corning remains highly vulnerable to technical profit-taking and multiple compression during periods of market volatility if execution does not substantially exceed buy-side expectations.
- Dilution Overhang from $2.0 Billion At-The-Market Equity Distribution Agreement: The establishment of an SEC-filed At-The-Market equity program allowing Corning to issue up to $2.0 billion in common stock introduces persistent share dilution overhang, adding sell-side pressure and capping intraday upside momentum.
- Segment Drag from Consumer Electronics and Non-AI End Markets: Despite robust AI-driven fiber demand, non-optical segments face cyclical drag, highlighted by a 3% year-over-year decline in Glass Innovations sales driven by memory pricing friction and softness across handheld, TV, and notebook consumer markets.
This article may include AI-generated content that is human-reviewed, which is for reference and general information purposes only and does not constitute investment advice.
Recommended Articles








Comments (0)
Click the $ button, enter the symbol, and select to link a stock, ETF, or other ticker.