


Home Depot Inc Stock (HD) Moved Down by 3.02% on Nov 3: What Signal Does It Send?


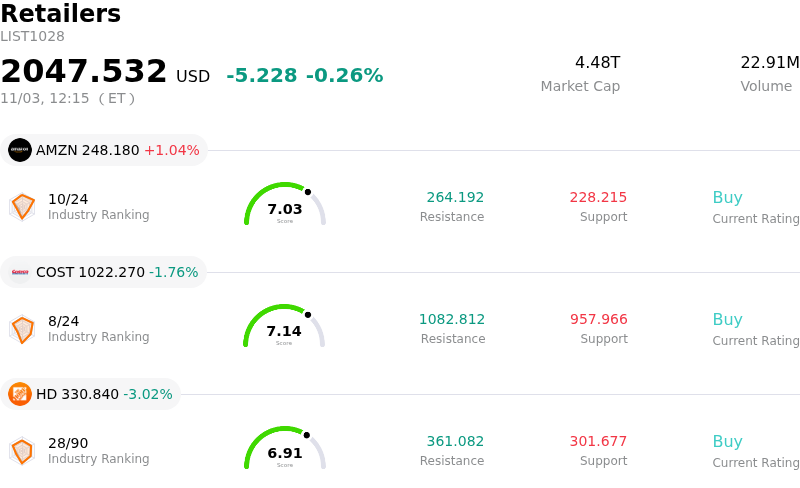
Home Depot Inc (HD) moved down by 3.02%. The Retailers sector is down by 0.26%. The company underperformed the industry. Top 3 stocks by turnover in the sector: Amazon.com Inc (AMZN) up 1.04%; Costco Wholesale Corp (COST) down 1.76%; Home Depot Inc (HD) down 3.02%.
What is driving Home Depot Inc (HD)’s stock price down today?
The downward price action and intraday volatility in Home Depot stock reflect persistent macroeconomic pressures surrounding the broader housing and consumer discretionary sectors. High mortgage rates continue to constrain existing home sales, dampening home turnover which serves as a primary driver for large-scale renovation and remodeling projects. While demand for smaller, routine maintenance tasks remains resilient, consumers continue to defer big-ticket discretionary home improvements due to elevated financing costs and cautious spending behaviors. This ongoing weakness in home sales activity creates persistent headwinds for average ticket growth and overall retail volume.
Market sentiment was also influenced by profit-taking dynamics following a short-term rebound in equity prices heading into the month. As broader equity market volatility increased, institutional investors recalibrated valuation multiples across consumer cyclical stocks. Given the current valuation multiples in home improvement retail relative to broader market uncertainty, shifts in investor sentiment and macro sector rebalancing frequently lead to increased intraday price volatility.
From an operational perspective, Home Depot continues to rely on its professional contractor segment and integrated logistics capabilities to stabilize revenue streams. Momentum in pro-focused services and specialized distribution has helped mitigate softer do-it-yourself consumer demand. However, near-term price discovery remains heavily linked to macroeconomic indicators, specifically interest rate policy shifts, mortgage rate trajectories, and broader housing market liquidity. Investors continue to seek clear evidence of an inflection in housing turnover as the core catalyst for sustained revenue acceleration.
Technical Analysis of Home Depot Inc (HD)
Technically, Home Depot Inc (HD) shows a MACD (12,26,9) value of 5.994, indicating a buy signal. The RSI at 62.908 suggests neutral condition and the Williams %R at 26.595 suggests buy condition. Please monitor closely.
Fundamental Analysis of Home Depot Inc (HD)
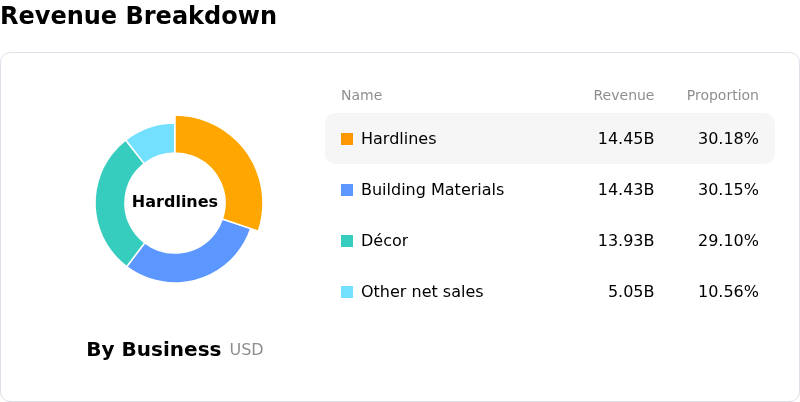
Home Depot Inc (HD) is in the Retailers industry. Its latest annual revenue is $164.68B, ranking 1 in the industry. The net profit is $14.16B, ranking 1 in the industry. Company Profile
Over the past month, multiple analysts have rated the company as Buy, with an average price target of $372.86, a high of $425.00, and a low of $255.00.
More details about Home Depot Inc (HD)
Company Specific Risks:
- Technical Overbought Conditions & Resistance Stalling: A sharp near-term rally pushing shares near key technical resistance at $341.51 has elevated the daily Relative Strength Index (RSI) above 73 into overbought territory, triggering immediate pullback risk and intraday volatility.
- Elevated Implied Volatility Ahead of Earnings: Option market implied volatility (IV30) has surged to 35.0%—ranking in the 88th percentile of its annual range—reflecting growing institutional hedging and market anxiety ahead of the upcoming fiscal Q3 earnings report.
- Persistent Housing Market Slump & High Mortgage Rates: Elevated mortgage rates hovering above 7% continue to lock in existing homeowners and depress residential real estate transactions, dampening consumer demand for major home improvement and discretionary renovation projects.
- ROIC Dilution & Professional Segment Margin Exposure: Strategic capital allocation toward expanding the professional (Pro) distribution segment has compressed Return on Invested Capital (ROIC) from over 31% down to 25.4%, exposing the firm to integration overhead and near-term margin pressure.
This article may include AI-generated content that is human-reviewed, which is for reference and general information purposes only and does not constitute investment advice.
Recommended Articles









Comments (0)
Click the $ button, enter the symbol, and select to link a stock, ETF, or other ticker.