


Solana (SOLUSD) Volatility Intensified on Nov 1: What You Should Know


Solana (SOLUSD) is down 1.10% at Nov 1 07:20(ET), now at $93.67, with a 7-day down of 6.96%.
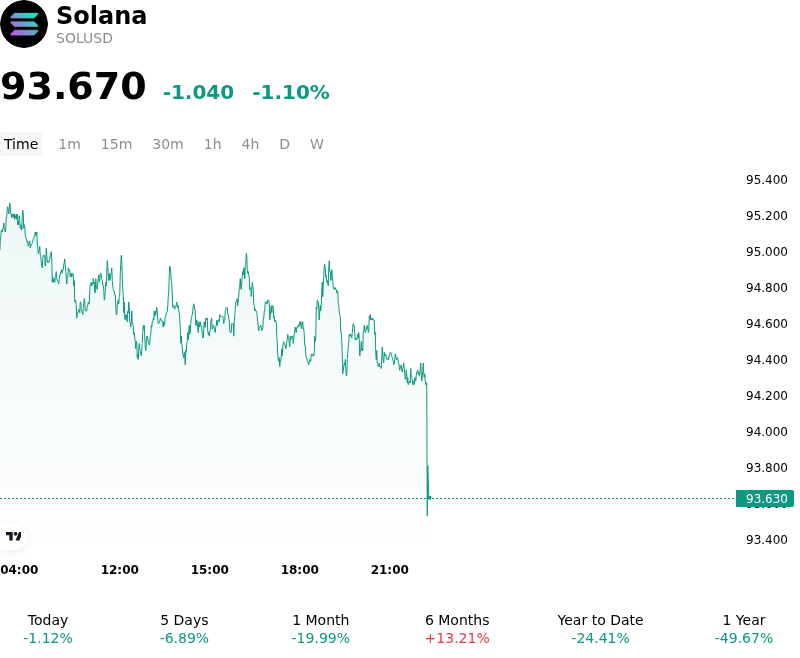
What is driving Solana (SOLUSD)’s stock price down today?
The downside pressure and intraday volatility observed in Solana reflect a tactical pullback and risk-off repricing across high-beta smart contract platforms. Rising US Treasury yields and a firm US dollar have tightened macro liquidity conditions, prompting institutional allocators to trim exposure to growth-sensitive digital assets. As broader market risk sentiment cooled, capital rotated toward defensive positioning, placing near-term selling pressure on Layer-1 tokens that had previously experienced strong momentum.
Asset-specific dynamics also contributed to the intraday retracement, highlighted by a temporary cooling in net inflows into spot Solana exchange-traded funds. Reduced institutional spot buying cleared the way for spot-market supply to test key technical support levels. Concurrently, perpetual futures markets saw targeted long liquidations as leveraged positions near upper resistance bands were forced to unwind. Funding rates across major derivatives venues compressed toward neutral levels, confirming that the move was primarily driven by liquidity-driven positioning resets rather than fundamental network distress.
Despite the corrective price action, underlying network fundamentals and long-term adoption metrics remain resilient. High staking participation rates continue to lock up circulating supply, while sustained activity in decentralized applications, real-world asset tokenization, and high-throughput network infrastructure maintain Solana's structural appeal for institutional investors. Moving forward, market participants will closely monitor Federal Reserve policy trajectories, spot ETF flow trends, and leverage accumulation in derivatives markets to gauge the sustainability of the current consolidation phase.
Technical Analysis of Solana (SOLUSD)
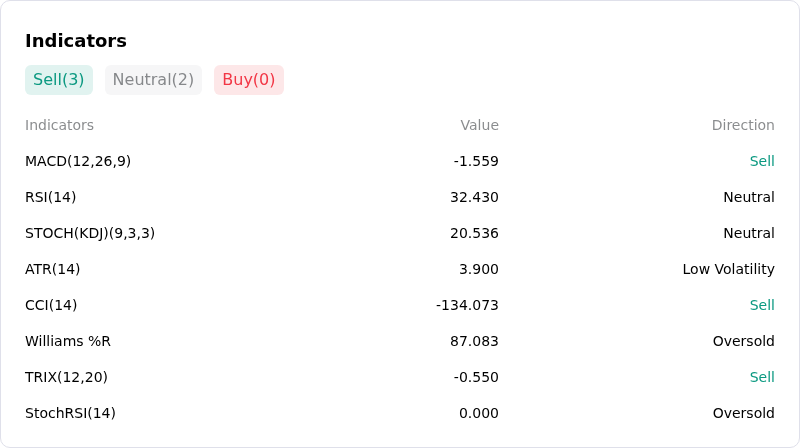
Technically, Solana (SOLUSD) shows a MACD (12,26,9) value of -1.559, indicating a sell signal. The RSI at 32.430 suggests neutral condition and the Williams %R at 87.083 suggests oversold condition. Please monitor closely.
More details about Solana (SOLUSD)
Recent Events and Risks:
- Exchange Exploit Volatility Spillover: Market-wide distress triggered by a major security exploit on Binance led to localized liquidity shocks, dragging SOL below the $100 psychological threshold amid elevated cross-venue market panic.
- Heavy Whale Exchange Inflows: Blockchain tracking reveals over $49 million worth of SOL (including 171,430 SOL from a single prominent whale wallet) was transferred to centralized exchanges over a 72-hour window, heightening immediate downside pressure and sell-off expectations.
- Institutional Capital Outflows: Institutional Solana investment products and spot ETFs recently registered consecutive sessions of multi-million dollar net outflows, demonstrating a temporary withdrawal of institutional bid support.
- Leverage Unwinds and Derivatives Liquidations: A technical breakdown beneath key support levels triggered automated long position liquidations across major derivatives exchanges, shifting funding rates negative and amplifying downside volatility.
This article may include AI-generated content that is human-reviewed, which is for reference and general information purposes only and does not constitute investment advice.
Recommended Articles








Comments (0)
Click the $ button, enter the symbol, and select to link a stock, ETF, or other ticker.