


Baker Hughes Co Stock (BKR) Moved Down by 5.76% on Oct 28: What Investors Need To Know



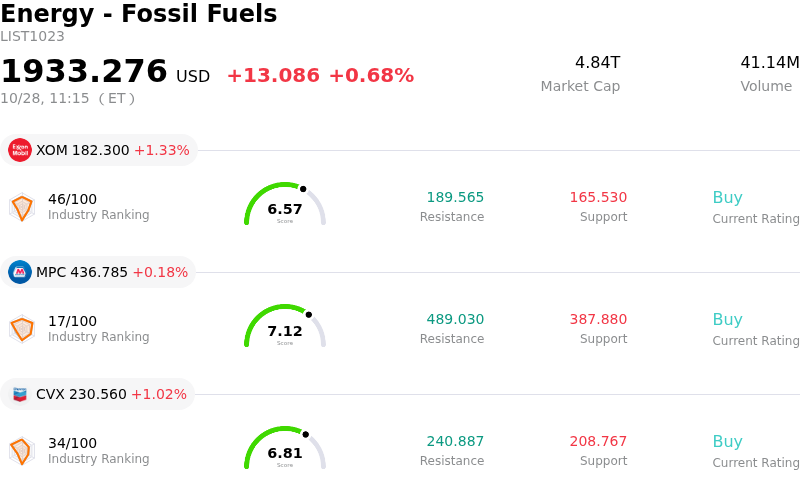
Baker Hughes Co (BKR) moved down by 5.76%. The Energy - Fossil Fuels sector is up by 0.68%. The company underperformed the industry. Top 3 stocks by turnover in the sector: Exxon Mobil Corp (XOM) up 1.33%; Marathon Petroleum Corp (MPC) up 0.18%; Chevron Corp (CVX) up 1.02%.
What is driving Baker Hughes Co (BKR)’s stock price down today?
Baker Hughes experienced downward momentum during the trading session following the release of its third-quarter financial results. Although the energy technology provider delivered top- and bottom-line results that surpassed Wall Street expectations on an adjusted basis, market sentiment was weighed down by a sharp contraction in GAAP net income and persistent concerns surrounding leverage and integration costs tied to its acquisition of Chart Industries. Investors largely looked past the headline beat to focus on near-term operational friction and balance sheet pressure.
The divergence between adjusted profitability and GAAP metrics served as the primary catalyst for the stock's weakness. While adjusted earnings and revenue benefited from solid execution across the Industrial and Energy Technology division and recovering oilfield services activity, GAAP net income fell significantly year-over-year. The decline reflected substantial transaction, restructuring, and closing expenses associated with incorporating Chart Industries into the portfolio. These integration burdens, combined with heightened debt levels, renewed investor skepticism regarding short-term free cash flow conversion and the timeline for operating margin expansion.
Despite the market's negative reaction, fundamental commercial momentum remained intact. The company reported robust order intake and a record backlog within its technology segment, driven by broad-based demand across natural gas infrastructure, liquefied natural gas projects, and power solutions for high-density artificial intelligence data centers. Management consequently raised its full-year order outlook for the technology division. Nevertheless, elevated valuation multiples and near-term margin dilution concerns caused market participants to de-risk, overshadowing long-term structural growth drivers.
Technical Analysis of Baker Hughes Co (BKR)
Technically, Baker Hughes Co (BKR) shows a MACD (12,26,9) value of 0.570, indicating a neutral signal. The RSI at 46.221 suggests neutral condition and the Williams %R at 55.846 suggests sell condition. Please monitor closely.
Fundamental Analysis of Baker Hughes Co (BKR)
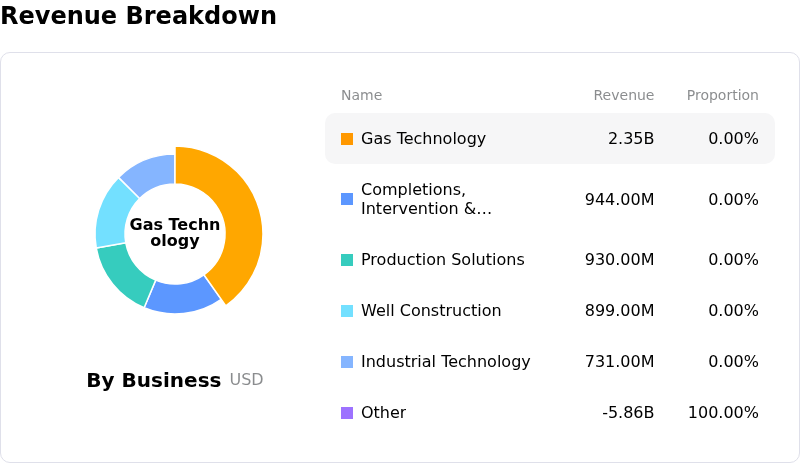
Baker Hughes Co (BKR) is in the Energy - Fossil Fuels industry. Its latest annual revenue is $27.73B, ranking 8 in the industry. The net profit is $2.59B, ranking 10 in the industry. Company Profile
Over the past month, multiple analysts have rated the company as Buy, with an average price target of $71.43, a high of $85.00, and a low of $51.00.
More details about Baker Hughes Co (BKR)
Company Specific Risks:
- GAAP Net Income Contraction: Baker Hughes reported a 33% year-over-year drop in Q3 2026 GAAP net income to $411 million ($0.41 GAAP diluted EPS), driven down by substantial transaction, restructuring, and integration expenses.
- Elevated Post-Acquisition Debt Leverage: Long-term debt surged to $17.48 billion following the completion of its all-cash acquisition of Chart Industries, prompting institutional concerns over heightened financial leverage and the pace of balance sheet deleveraging.
- Integration Costs and Delayed Merger Synergies: Profit margins face near-term pressure from Chart Industries integration charges and non-cash amortization of intangible assets, while long product lead times delay the materialization of revenue synergies.
- Supply Chain Bottlenecks and Geopolitical Vulnerabilities: Operations face execution risks from logistics issues in aeroderivative equipment along with Middle East geopolitical tensions that threaten activity levels across the Oilfield Services & Equipment (OFSE) and Industrial & Energy Technology (IET) segments.
This article may include AI-generated content that is human-reviewed, which is for reference and general information purposes only and does not constitute investment advice.
Recommended Articles










Comments (0)
Click the $ button, enter the symbol, and select to link a stock, ETF, or other ticker.