


SpaceX Stock (SPCX) Moved Down by 3.51% on Oct 28: Drivers Behind the Movement



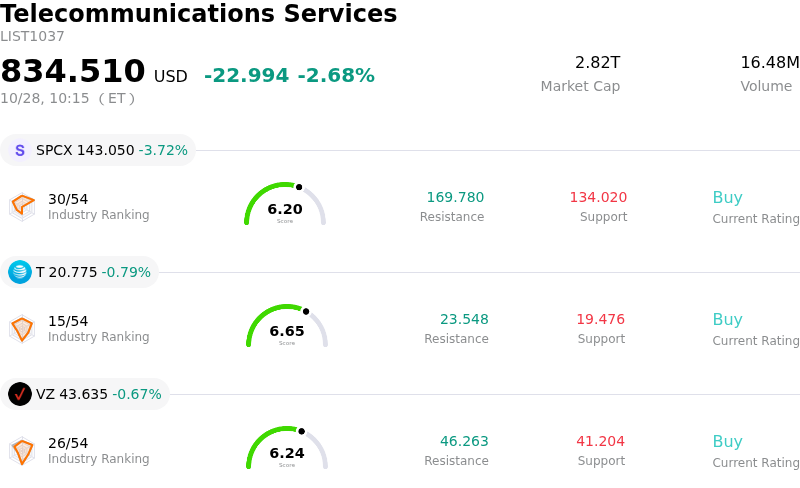
SpaceX (SPCX) moved down by 3.51%. The Telecommunications Services sector is down by 2.68%. The company underperformed the industry. Top 3 stocks by turnover in the sector: SpaceX (SPCX) down 3.51%; AT&T Inc (T) down 0.79%; Verizon Communications Inc (VZ) down 0.67%.
What is driving SpaceX (SPCX)’s stock price down today?
Space Exploration Technologies Corp. stock experienced notable intraday volatility and closed lower as market participants digested a wave of fundamental catalysts and near-term technical factors. Following a strong multi-day advance driven by robust third-quarter financial results, the stock faced profit-taking pressures from short-term traders. Broad market movements across high-growth technology and aerospace sectors also contributed to caution, leading investors to rebalance exposure despite upbeat fundamental headlines.
A primary catalyst for the downward trajectory centers on equity supply dynamics following recent share unlock schedules. As substantial volumes of previously restricted shares became eligible for trading late in the month, increased secondary market liquidity created temporary overhead supply. Furthermore, while recent top-line momentum has been driven by rapid acceleration in artificial intelligence computing operations and Starlink connectivity services, the company carries a premium valuation multiple. This elevated valuation leaves the stock particularly susceptible to pullbacks whenever capital expenditure expectations or broader tech valuations undergo short-term reassessment.
From an operational and institutional perspective, Wall Street sentiment remains largely constructive. Regulatory filings detailing a major multi-year computing infrastructure agreement with Anthropic emphasized the company's expanding role in AI infrastructure, though analysts noted that customer concentration risks could introduce volatility until revenue streams further diversify. Positive institutional actions, including additions to high-profile brokerage buy lists and increased price targets from major investment banks, reflect confidence in the long-term outlook for satellite communications and reusable launch capabilities.
In summary, the session's decline reflects a typical profit-taking pullback compounded by new share supply entering the market rather than a structural shift in core fundamentals. Near-term share price performance will likely depend on how efficiently the market absorbs current share supply, progress on artificial intelligence infrastructure buildouts, and upcoming macroeconomic indicators affecting growth-oriented assets.
Technical Analysis of SpaceX (SPCX)
Technically, SpaceX (SPCX) shows a MACD (12,26,9) value of -3.150, indicating a neutral signal. The RSI at 43.254 suggests neutral condition and the Williams %R at 90.456 suggests oversold condition. Please monitor closely.
Fundamental Analysis of SpaceX (SPCX)
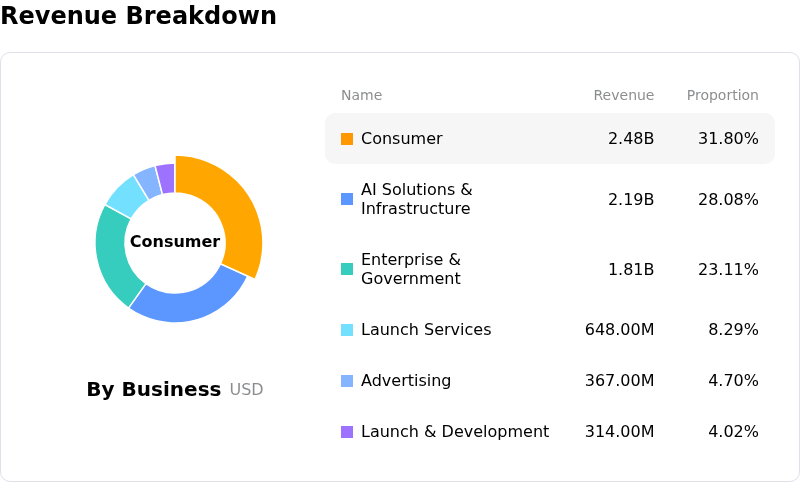
SpaceX (SPCX) is in the Telecommunications Services industry. Its latest annual revenue is $18.67B, ranking 10 in the industry. The net profit is $-4.94B, ranking 61 in the industry. Company Profile
Over the past month, multiple analysts have rated the company as Buy, with an average price target of $231.06, a high of $800.00, and a low of $100.00.
More details about SpaceX (SPCX)
Company Specific Risks:
- Excessive Capital Expenditures and Cash Burn: Third-quarter capital expenditures reached $19.6 billion—outpacing quarterly revenue of $14.58 billion by $5 billion—driven primarily by $16.4 billion spent on the Super Intelligence AI division, with fourth-quarter capex projected to swell to $35–$40 billion against estimated revenues of $23 billion.
- Mounting Debt Load and High Borrowing Costs: The company is securing $40 billion in debt carrying high interest rates up to 8.3% to purchase GPUs and fund data-center expansion, significantly increasing interest expenses and depleting net cash balances despite its earlier IPO proceeds.
- Insider Lock-Up Expirations and Share Overhang: The staggered unwinding of insider lock-up release dates—notably a post-Q3 earnings wave freeing up to 1.3 billion shares (approximately 28% of the relevant share pool)—is introducing heavy secondary supply pressure and triggering sharp intraday stock volatility.
- AI Customer Concentration and Short-Term Contract Exposure: Wall Street analysts flagged heightened revenue vulnerability within the AI segment, noting heavy reliance on key corporate clients paying monthly fees under agreements with short 90-day termination notices, leaving projected compute revenues exposed to potential customer churn.
This article may include AI-generated content that is human-reviewed, which is for reference and general information purposes only and does not constitute investment advice.
Recommended Articles









Comments (0)
Click the $ button, enter the symbol, and select to link a stock, ETF, or other ticker.