


Banco Santander SA Stock (SAN) Moved Down by 4.17% on Oct 28: Key Drivers Unveiled



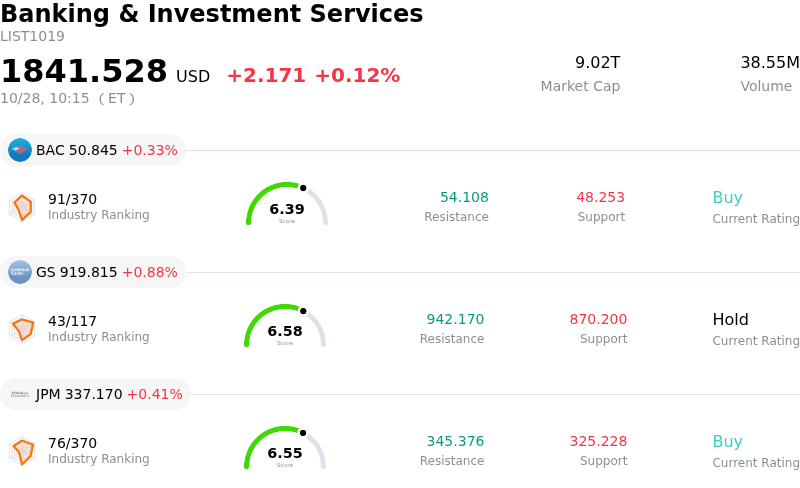
Banco Santander SA (SAN) moved down by 4.17%. The Banking & Investment Services sector is up by 0.12%. The company underperformed the industry. Top 3 stocks by turnover in the sector: Bank of America Corp (BAC) up 0.33%; Goldman Sachs Group Inc (GS) up 0.88%; JPMorgan Chase & Co (JPM) up 0.41%.
What is driving Banco Santander SA (SAN)’s stock price down today?
Banco Santander experienced notable downward trading pressure following the release of its third-quarter financial results. Although the global banking giant achieved a minor beat on adjusted earnings per share, top-line quarterly revenues fell short of consensus expectations. Investor disappointment was further amplified by a sequential decline in quarterly attributable profit, driven by integration charges and intangible asset impairments tied to recent strategic acquisitions, including Webster Financial and TSB.
Underlying profitability was additionally strained by a sequential uptick in net loan-loss provisions, which exceeded analyst forecasts. Higher provisions, largely reflecting macroeconomic volatility and credit risk trends in select regional portfolios such as Latin America, heightened market caution regarding asset quality. Furthermore, the consolidation of the Webster transaction temporarily exerted pressure on the bank's Common Equity Tier 1 capital ratio, introducing near-term balance sheet friction despite management reaffirming its full-year guidance and capital distribution plans.
Broader market dynamics and regional uncertainty have added another layer of intraday volatility. Recent analyst downgrades citing regional economic risks, alongside persistent caution surrounding net interest margin pressure, have dampened investor appetite. While Banco Santander continues to show healthy organic customer additions, disciplined cost control, and ongoing share buybacks, short-term negative sentiment around top-line revenue softness, elevated credit provisioning, and integration execution expenses remains the primary catalyst behind the stock's retreat.
Technical Analysis of Banco Santander SA (SAN)
Technically, Banco Santander SA (SAN) shows a MACD (12,26,9) value of -0.214, indicating a sell signal. The RSI at 25.644 suggests sell condition and the Williams %R at 98.082 suggests oversold condition. Please monitor closely.
Fundamental Analysis of Banco Santander SA (SAN)
Banco Santander SA (SAN) is in the Banking & Investment Services industry. Its latest annual revenue is $65.95B, ranking 5 in the industry. The net profit is $15.90B, ranking 5 in the industry. Company Profile
Over the past month, multiple analysts have rated the company as Buy, with an average price target of $14.78, a high of $15.70, and a low of $13.86.
More details about Banco Santander SA (SAN)
Company Specific Risks:
- Q3 Revenue and Core Income Miss: Banco Santander reported third-quarter 2026 revenue of €15.89 billion ($18.0 billion), missing Wall Street estimates by €370 million as both net interest income (€11.83 billion) and net fee income (€3.50 billion) came in below analyst consensus expectations.
- Surging Loan-Loss Provisions: Third-quarter net loan-loss provisions increased 4.1% sequentially to €3.49 billion—surpassing consensus forecasts of €3.39 billion—bringing nine-month loan-loss provisions up 13% year-over-year to €10.06 billion, heavily impacted by macroeconomic volatility in Latin America.
- M&A Integration Costs and Asset Impairments: Sequential attributable net profit declined 2.4% in Q3 2026 as earnings were weighed down by €666 million in integration charges and intangible asset impairment costs related to recent transactions involving Webster Financial and TSB.
- Capital Buffer Dilution Post-Acquisition: The bank's Common Equity Tier 1 (CET1) capital ratio contracted to 12.7% due to a 147 basis point capital drain associated with closing the Webster acquisition, leaving capital reserves positioned near the lower bound of its 12% to 13% target operating range.
This article may include AI-generated content that is human-reviewed, which is for reference and general information purposes only and does not constitute investment advice.
Recommended Articles









Comments (0)
Click the $ button, enter the symbol, and select to link a stock, ETF, or other ticker.