


Ge Vernova Inc Stock (GEV) Moved Up by 3.37% on Oct 27: Facts Behind the Movement



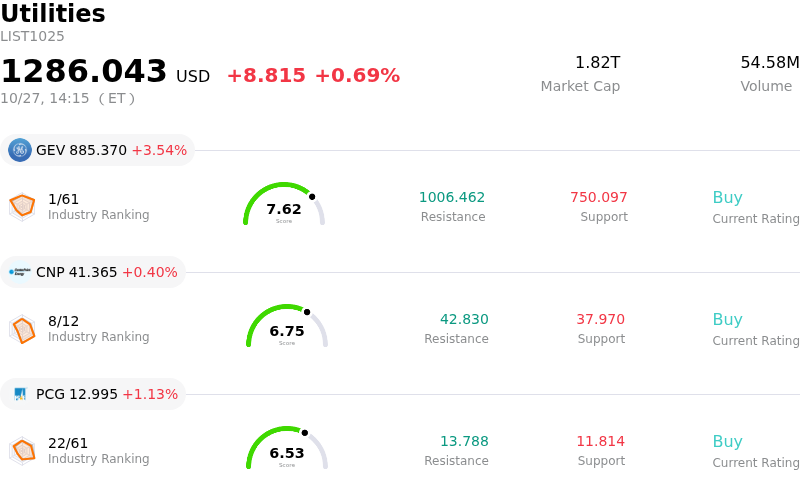
Ge Vernova Inc (GEV) moved up by 3.37%. The Utilities sector is up by 0.69%. The company outperformed the industry. Top 3 stocks by turnover in the sector: Ge Vernova Inc (GEV) up 3.54%; CenterPoint Energy Inc (CNP) up 0.38%; PG&E Corp (PCG) up 1.13%.
What is driving Ge Vernova Inc (GEV)’s stock price up today?
GE Vernova experienced upward price momentum accompanied by heightened intraday volatility as market participants actively repositioned ahead of the company's impending third-quarter financial results. Sentiment across the power infrastructure and electrical equipment sector remains anchored by long-term secular tailwinds, including surging electricity demand from artificial intelligence data centers, utility grid modernization, and global energy transition initiatives. Positive sentiment surrounding commercial project wins in gas power and expanding grid solutions helped reinforce investor confidence in the company's multi-year revenue visibility and expanding order backlog.
Institutional portfolio adjustments and wall street research commentary further supported intraday buying activity. Recent regulatory filings indicated position increases by multiple asset managers, while several major brokerage firms maintained favorable ratings and price targets. Analysts continue to highlight structural demand for heavy-duty gas turbines and high-margin electrification services, which investors view as key offsets to ongoing cost pressures within the offshore wind segment. Expectations of robust order intake and forward guidance updates served as primary drivers encouraging capital inflows prior to the earnings release.
Intraday price action was also influenced by technical factors and ex-dividend date dynamics. Despite the typical downward baseline adjustment associated with going ex-dividend for its quarterly cash distribution, strong dip-buying and short-covering activity absorbed the dividend effect. A broader recovery in power-infrastructure equities following recent macro-driven sector pullbacks added upward momentum, resulting in elevated volume and wide trading ranges as investors weighed premium valuation multiples against strong long-term fundamentals.
Technical Analysis of Ge Vernova Inc (GEV)
Technically, Ge Vernova Inc (GEV) shows a MACD (12,26,9) value of -23.650, indicating a sell signal. The RSI at 43.643 suggests neutral condition and the Williams %R at 61.166 suggests sell condition. Please monitor closely.
Media Coverage of Ge Vernova Inc (GEV)
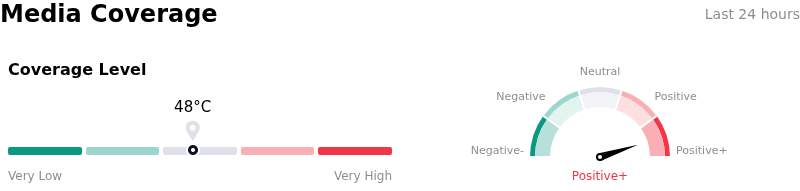
In terms of media coverage, Ge Vernova Inc (GEV) shows a coverage score of 48, indicating a moderate level of media attention. The overall market sentiment index is currently in extremely bullish zone.
Fundamental Analysis of Ge Vernova Inc (GEV)
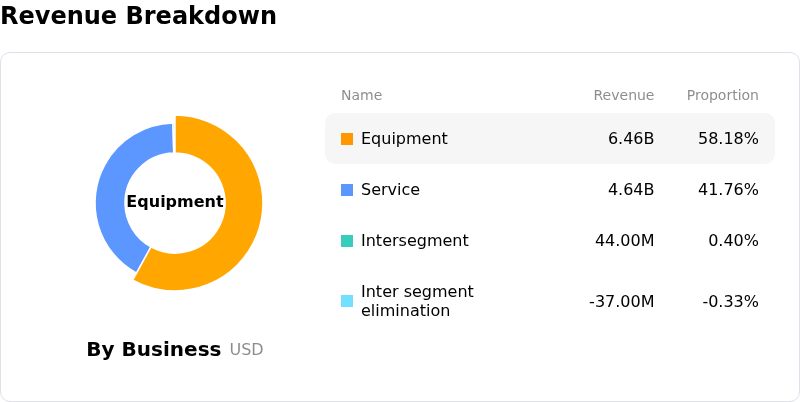
Ge Vernova Inc (GEV) is in the Utilities industry. Its latest annual revenue is $38.07B, ranking 2 in the industry. The net profit is $4.88B, ranking 4 in the industry. Company Profile
Over the past month, multiple analysts have rated the company as Buy, with an average price target of $1183.75, a high of $1450.00, and a low of $470.00.
More details about Ge Vernova Inc (GEV)
Company Specific Risks:
- Earnings Volatility and Hyperscaler Capex Anxiety: Ahead of its third-quarter earnings report, GEV has experienced heightened intraday trading volatility following sharp pullbacks driven by investor concerns over potential decelerations in AI infrastructure spending and capital expenditure by tech hyperscalers.
- Valuation Compression and Analyst Target Downgrades: Wall Street research firms, including JPMorgan and Susquehanna, recently reduced their price targets on GEV stock, citing demanding valuation multiples and elevated execution risks required to meet multi-year margin expectations.
- Persistent Wind Segment Losses and Tariff Risks: The company continues to face operational drag from its Wind business, which suffers from declining order volumes and ongoing segment EBITDA losses, further exacerbated by trade policy uncertainty and potential tariff burdens on international supply chains.
- Backlog Execution and Supply Bottlenecks: Institutional investors are scrutinizing GEV's operational capacity to efficiently convert its $176 billion order backlog into cash flow as manufacturing capacity limitations and supply chain bottlenecks risk delaying equipment delivery schedules.
This article may include AI-generated content that is human-reviewed, which is for reference and general information purposes only and does not constitute investment advice.
Recommended Articles









Comments (0)
Click the $ button, enter the symbol, and select to link a stock, ETF, or other ticker.