


RTX Corp Stock (RTX) Moved Up by 3.23% on Oct 26: Drivers Behind the Movement



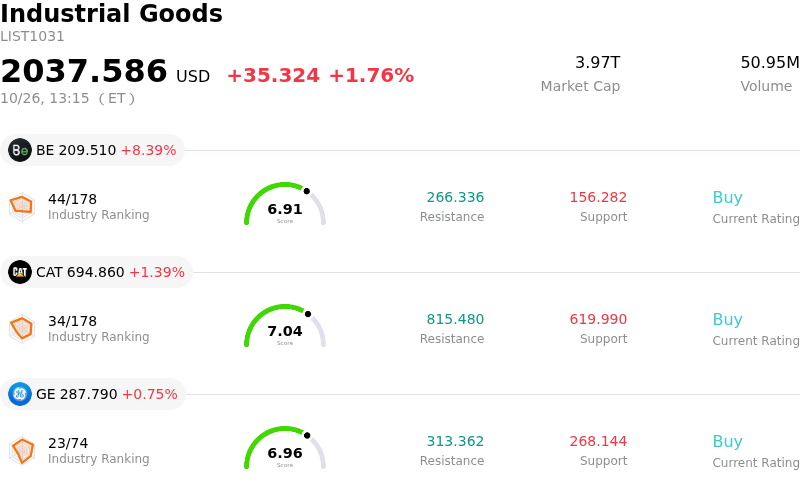
RTX Corp (RTX) moved up by 3.23%. The Industrial Goods sector is up by 1.76%. The company outperformed the industry. Top 3 stocks by turnover in the sector: Bloom Energy Corp (BE) up 8.39%; Caterpillar Inc (CAT) up 1.39%; General Electric Co (GE) up 0.75%.
What is driving RTX Corp (RTX)’s stock price up today?
RTX Corporation experienced upward momentum driven primarily by the strong market reaction to its recent third-quarter financial results and upgraded full-year outlook. The company delivered robust double-digit organic revenue growth across both its commercial aerospace and defense divisions, comfortably surpassing consensus Wall Street estimates for top-line revenue and adjusted earnings per share. Operating profit expanded significantly, supported by favorable product mix, operational productivity, and cost recoveries under international emergency framework provisions. Reflecting sustained demand and operational execution, management raised its full-year guidance across adjusted sales, adjusted earnings per share, and free cash flow, reinforcing institutional confidence in the company's multi-year operational trajectory.
The positive investor sentiment is further underpinned by an expanding order backlog that reached record levels, providing exceptional long-term revenue visibility. Defense bookings surged following major multi-year contract awards for critical missile systems, including AMRAAM air-to-air missiles, Tomahawk cruise missiles, and Standard Missile interceptors for naval defense programs. Simultaneously, the commercial aerospace segment continues to benefit from expanding original equipment manufacturing volumes and robust demand for commercial aftermarket maintenance, repair, and overhaul services across Pratt & Whitney and Collins Aerospace, which helps absorb localized restructuring costs and legacy supply chain adjustments.
Broader sector dynamics and institutional capital inflows have also provided strong support for the stock. Heightened geopolitical tensions and rising defense budgets among global allies continue to serve as key structural tailwinds for top-tier defense prime contractors. Positive momentum indicators following the earnings release prompted re-entry from institutional portfolio managers and sector-focused funds. Although market participants continue to monitor execution timelines and raw material supply chain constraints, the combination of a record multi-year contract backlog, strong commercial fleet utilization, and upgraded cash flow guidance continues to power momentum in the stock.
Technical Analysis of RTX Corp (RTX)
Technically, RTX Corp (RTX) shows a MACD (12,26,9) value of 3.420, indicating a neutral signal. The RSI at 58.665 suggests neutral condition and the Williams %R at 0.055 suggests overbought condition. Please monitor closely.
Media Coverage of RTX Corp (RTX)
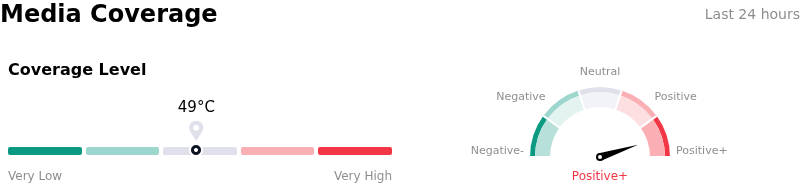
In terms of media coverage, RTX Corp (RTX) shows a coverage score of 49, indicating a moderate level of media attention. The overall market sentiment index is currently in extremely bullish zone.
Fundamental Analysis of RTX Corp (RTX)
RTX Corp (RTX) is in the Industrial Goods industry. Its latest annual revenue is $88.60B, ranking 2 in the industry. The net profit is $6.73B, ranking 2 in the industry. Company Profile
Over the past month, multiple analysts have rated the company as Buy, with an average price target of $223.70, a high of $250.00, and a low of $164.00.
More details about RTX Corp (RTX)
Company Specific Risks:
- One-Time Tariff Recovery and Free Cash Flow Drop: RTX's Q3 adjusted earnings per share were artificially boosted by a $0.25 non-recurring IEEPA tariff cost recovery, while quarterly free cash flow fell 47% year-over-year due to working capital expansion and timing reversals, raising concerns among institutional analysts about earnings quality.
- Pratt & Whitney Customer Bankruptcy Charge: The Pratt & Whitney division recognized a $363 million charge linked to a customer bankruptcy, underscoring credit risk and working capital drag as the segment works through operational supply chain pressures to scale Geared Turbofan (GTF) engine overhauls.
- Substantial Capex Drag and Paused Share Buybacks: Capital commitments of $10 billion to $10.5 billion in 2026 for development and capital expenditures pose significant operating margin risks if capacity conversion stalls, while share buybacks remain paused amid government contract scrutiny and tight working capital requirements.
- Elevated Valuation Multiple and Analyst Target Trims: Trading at approximately 26x forward earnings and over 23% above conservative fair value estimates, RTX faces valuation compression risk following recent analyst downgrades and price target reductions from firms including Deutsche Bank and TD Cowen.
This article may include AI-generated content that is human-reviewed, which is for reference and general information purposes only and does not constitute investment advice.
Recommended Articles







Comments (0)
Click the $ button, enter the symbol, and select to link a stock, ETF, or other ticker.