


Ge Vernova Inc Stock (GEV) Moved Up by 4.79% on Oct 26: Facts Behind the Movement



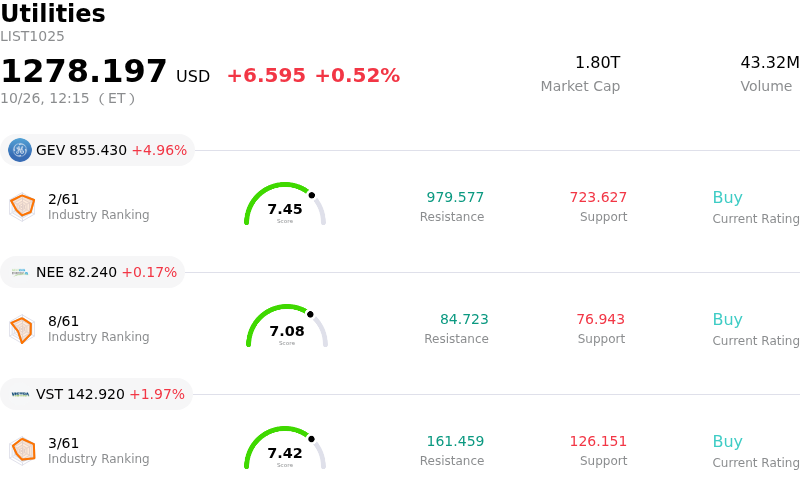
Ge Vernova Inc (GEV) moved up by 4.79%. The Utilities sector is up by 0.52%. The company outperformed the industry. Top 3 stocks by turnover in the sector: Ge Vernova Inc (GEV) up 4.96%; Nextera Energy Inc (NEE) up 0.17%; Vistra Corp (VST) up 1.97%.
What is driving Ge Vernova Inc (GEV)’s stock price up today?
GE Vernova experienced a strong upward move accompanied by significant intraday volatility as market participants actively repositioned ahead of the company's upcoming third-quarter earnings report. Following a sharp pullback in preceding sessions sparked by broader market anxieties over tech hyperscaler artificial intelligence infrastructure spending schedules, dip-buying institutional interest resurfaced. Investors took advantage of discounted valuation levels to re-establish positions in a market leader poised to benefit from structural global power demand.
Near-term buying pressure was further reinforced by corporate catalysts and fundamental demand drivers. The stock's impending ex-dividend date encouraged dividend-capture strategies, while fundamental sentiment was underpinned by the firm's expanding multi-billion-dollar backlog in power and electrification equipment. Sustained global demand for heavy-duty gas turbines, power grid equipment, transformers, and switchgear—driven by both traditional utilities and expanding data center footprints—continues to offer clear multi-year revenue visibility, attracting buyers during periods of market weakness.
Looking forward, the pronounced intraday fluctuations highlight market sensitivity ahead of the quarterly earnings disclosure. Investors will be scrutinizing backlog margin performance, equipment delivery execution, and updated management commentary regarding capital allocation and forward guidance. While long-term secular tailwinds tied to grid modernization and the energy transition remain intact, short-term trading volatility is expected to remain elevated until the official financial results provide complete operational clarity.
Technical Analysis of Ge Vernova Inc (GEV)
Technically, Ge Vernova Inc (GEV) shows a MACD (12,26,9) value of -31.778, indicating a sell signal. The RSI at 37.860 suggests neutral condition and the Williams %R at 75.261 suggests sell condition. Please monitor closely.
Media Coverage of Ge Vernova Inc (GEV)
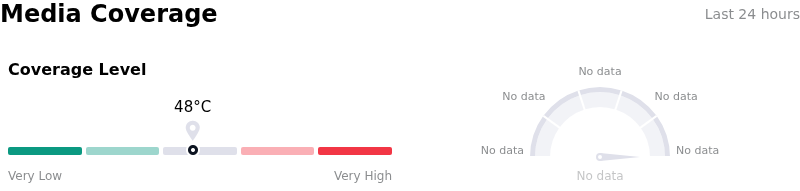
In terms of media coverage, Ge Vernova Inc (GEV) shows a coverage score of 48, indicating a moderate level of media attention. The overall market sentiment index is currently in extremely bullish zone.
Fundamental Analysis of Ge Vernova Inc (GEV)
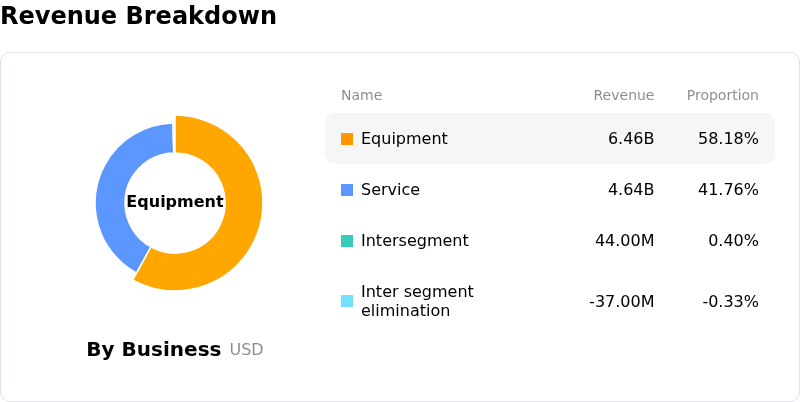
Ge Vernova Inc (GEV) is in the Utilities industry. Its latest annual revenue is $38.07B, ranking 2 in the industry. The net profit is $4.88B, ranking 4 in the industry. Company Profile
Over the past month, multiple analysts have rated the company as Buy, with an average price target of $1183.75, a high of $1450.00, and a low of $470.00.
More details about Ge Vernova Inc (GEV)
Company Specific Risks:
- AI Infrastructure Spending & Sector Rotation Concerns: Recent sector-wide de-risking in AI-adjacent power names has driven sharp intraday sell-offs in GEV stock, as institutional investors express caution over data center capital expenditure sustainability and financing constraints.
- Persistent Wind Segment Profitability Drag: Operational challenges and ongoing EBITDA losses within GEV's Wind division continue to hamper overall gross margin expansion and offset operational gains in the Power and Electrification segments.
- Backlog Cash Conversion & Pre-Earnings Volatility: Following a Q2 earnings per share miss, institutional scrutiny has intensified regarding GEV's ability to efficiently convert its $176 billion order backlog into realized cash flow ahead of its Q3 earnings release.
- Analyst Price Target Downgrades: Major Wall Street research firms, including JPMorgan and Susquehanna, recently reduced their price targets on GEV stock due to valuation concerns and execution risks ahead of quarterly earnings, amplifying short-term downside pressure.
This article may include AI-generated content that is human-reviewed, which is for reference and general information purposes only and does not constitute investment advice.
Recommended Articles








Comments (0)
Click the $ button, enter the symbol, and select to link a stock, ETF, or other ticker.