


Morgan Stanley Stock (MS) Moved Down by 3.23% on Oct 14: Facts Behind the Movement



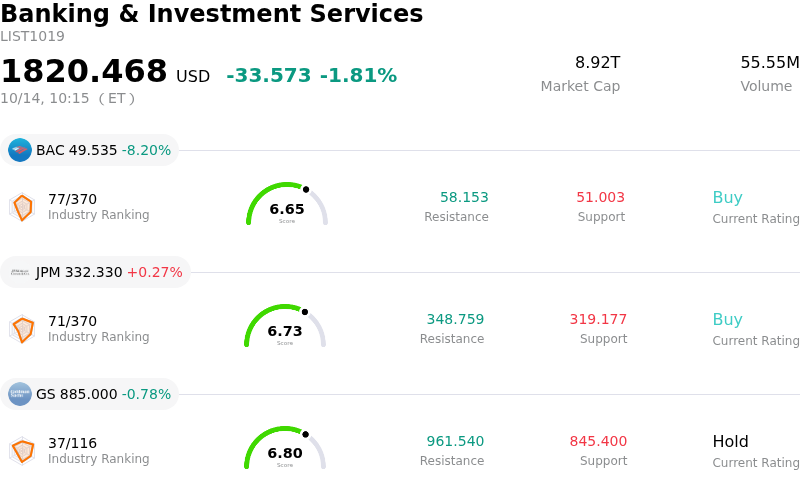
Morgan Stanley (MS) moved down by 3.23%. The Banking & Investment Services sector is down by 1.81%. The company underperformed the industry. Top 3 stocks by turnover in the sector: Bank of America Corp (BAC) down 8.16%; JPMorgan Chase & Co (JPM) up 0.30%; Goldman Sachs Group Inc (GS) down 0.78%.
What is driving Morgan Stanley (MS)’s stock price down today?
Morgan Stanley posted its third-quarter earnings report, topping consensus Wall Street expectations on both net revenue and diluted earnings per share. Results were buoyed by strong performance in equity trading within Institutional Securities as well as solid asset management fee flows in Wealth Management. However, despite the headline financial beats, the stock experienced notable intraday downward volatility as market participants engaged in a textbook sell-the-news response. Investors expressed concern over whether the surge in trading revenue and client activity could be sustained in subsequent quarters following exceptionally high benchmarks set earlier in the year.
Underneath the primary headline results, segment divergence highlighted operational vulnerabilities that weighed on market sentiment. Fixed income trading revenues contracted year over year, hampered by softer demand in securitized products and commodities, while Investment Management revenue declined due to lower performance-based income. Additionally, management noted an increase in provisions for credit losses tied to corporate and commercial real estate exposures. These mixed segment results focused institutional attention on underlying credit quality risks and potential margin compression in a complex macro environment.
Broader sector positioning and macroeconomic factors further exacerbated the day's pullbacks. Earnings reports from peer investment banks earlier in the week had already elevated market expectations for financial sector earnings, leaving little room for additional valuation expansion. Continued uncertainty around central bank monetary policy, elevated interest rates, and cautious corporate dealmaking activity continue to present headwinds for long-term investment banking pipelines. Combined with recent cautious analyst commentary and technical resistance levels, institutional investors opted to de-risk portfolios and realize profits following the earnings event.
Technical Analysis of Morgan Stanley (MS)
Technically, Morgan Stanley (MS) shows a MACD (12,26,9) value of -0.625, indicating a sell signal. The RSI at 24.633 suggests sell condition and the Williams %R at 98.219 suggests oversold condition. Please monitor closely.
Media Coverage of Morgan Stanley (MS)
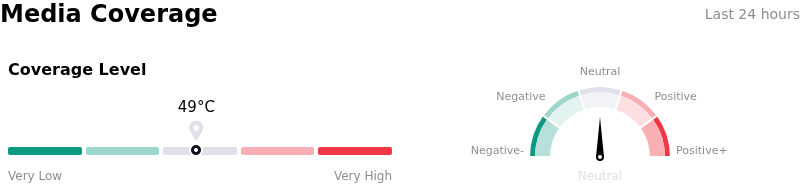
In terms of media coverage, Morgan Stanley (MS) shows a coverage score of 49, indicating a moderate level of media attention. The overall market sentiment index is currently in neutral zone.
Fundamental Analysis of Morgan Stanley (MS)
Morgan Stanley (MS) is in the Banking & Investment Services industry. Its latest annual revenue is $114.74B, ranking 3 in the industry. The net profit is $16.25B, ranking 2 in the industry. Company Profile
Over the past month, multiple analysts have rated the company as Buy, with an average price target of $224.11, a high of $262.00, and a low of $199.00.
More details about Morgan Stanley (MS)
Company Specific Risks:
- Fixed Income and Commodities Trading Softness: Morgan Stanley reported a 7% year-over-year decline in third-quarter 2026 Fixed Income trading revenue down to $2.0 billion, driven by noticeable weakness in commodities and securitized products.
- Investment Management Revenue Contraction: Third-quarter Investment Management segment revenues dropped 12% year-over-year to $1.46 billion, leading to a 29% decline in pretax income due to a negative reversal of accrued carried interest in private funds.
- Rising Credit Loss Provisions in Real Estate Lending: The firm flagged elevated provisions for credit losses in its Q3 2026 Form 8-K filing, specifically driven by growing risk exposure across its corporate and commercial real estate (CRE) loan portfolios.
- Technical Overhead and Valuation Drag: Shares remain technically weak below their 200-day moving average after pulling back significantly from July highs of $232.25, creating persistent selling pressure despite the overall quarterly earnings beat.
This article may include AI-generated content that is human-reviewed, which is for reference and general information purposes only and does not constitute investment advice.
Recommended Articles







Comments (0)
Click the $ button, enter the symbol, and select to link a stock, ETF, or other ticker.