


Cotton Futures (COTTON-F) Volatility Intensified on Oct 14: What to Watch



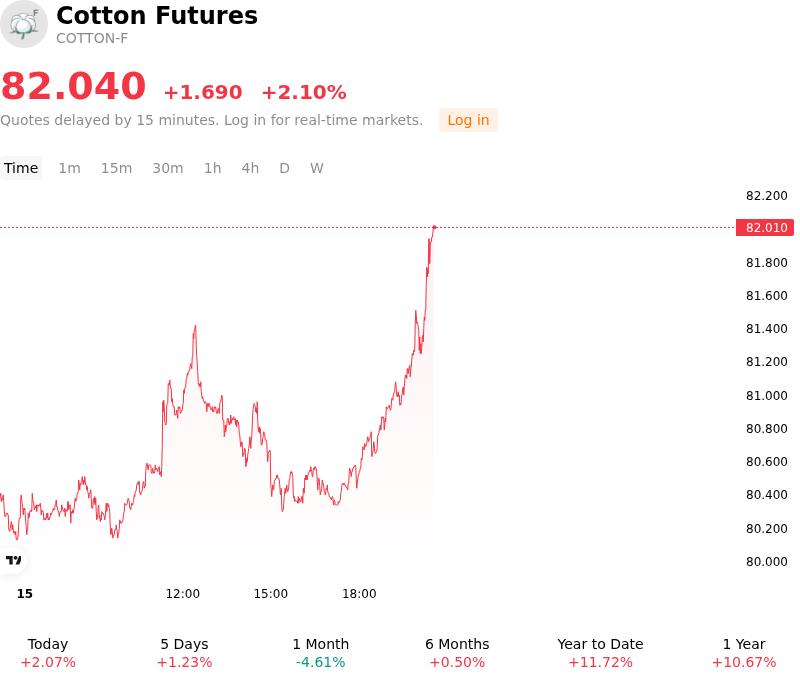
Cotton Futures (COTTON-F) is up 2.10% at Oct 14 08:30(ET), now at $82.04, with a 7-day up of 2.74%.
What is driving Cotton Futures (COTTON-F)’s stock price up today?
The upward movement in cotton futures was primarily driven by a surge in physical market buying and commercial mill fixation activity, alongside supportive spillovers from broader energy markets. Despite recent global production revisions pointing to expanding supply, robust import demand from key Asian textile hubs provided immediate price support. Furthermore, a firming trend in crude oil prices raised synthetic fiber production costs, particularly for polyester, enhancing the relative price competitiveness of natural cotton and encouraging textile manufacturers to secure forward supply commitments.
Macroeconomic conditions and regional spot market tightness further reinforced the bullish tone. Softness in the U.S. dollar lowered purchasing costs for foreign buyers, providing an added catalyst for international trade flows. Simultaneously, spot market basis strengthened in major Asian producing regions, where farmers and ginners resisted selling at lower price levels, resulting in localized tightness in immediate physical availability. This holding pattern compelled commercial buyers to turn to the futures market to manage price risk, generating steady buying pressure across active contract months.
Institutional positioning and technical factors also amplified the move. Following a period where prices traded near multi-month lows, short-covering by speculative funds was triggered as benchmark contracts cleared short-term resistance levels. Looking forward, institutional market participants are closely monitoring the seasonal progress of the North American harvest, global export shipment paces, and textile mill operating rates across major consuming nations to gauge the durability of this recovery.
Technical Analysis of Cotton Futures (COTTON-F)
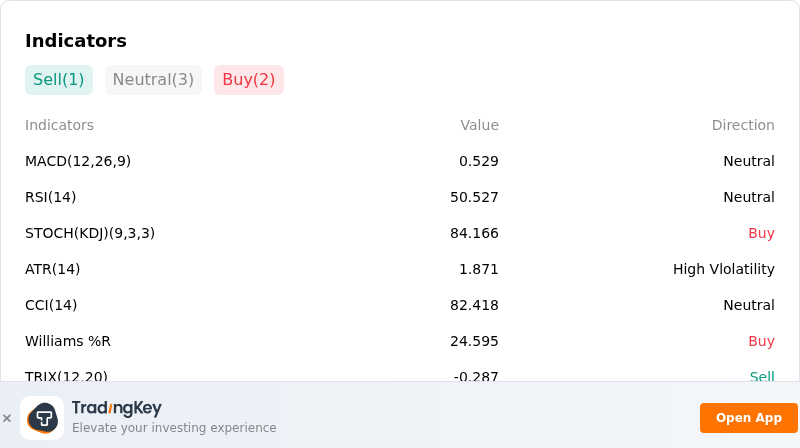
Technically, Cotton Futures (COTTON-F) shows a MACD (12,26,9) value of 0.529, indicating a neutral signal. The RSI at 50.527 suggests neutral condition and the Williams %R at 24.595 suggests buy condition. Please monitor closely.
More details about Cotton Futures (COTTON-F)
Recent Events and Risks:
- WASDE Production and Carryout Revisions: The latest USDA World Agricultural Supply and Demand Estimates report increased projected U.S. cotton production to 13.44 million bales and pushed domestic ending stocks up 6% to 3.80 million bales, elevating the stocks-to-use ratio to 27.5%. Globally, output was revised up by over 600,000 bales—led by gains in Brazil and the U.S.—raising world carryout projections and reinforcing supply-side pressure on futures.
- Sluggish Chinese Demand and Tariff Relief Omission: Sales of U.S. raw cotton to China remain sharply depressed compared to historical averages, further dampened by recent trade discussions that left raw cotton off initial reciprocal tariff-relief lists. The absence of aggressive Chinese state reserve or commercial buying removes a primary speculative catalyst needed to absorb expanding U.S. export availability.
- Fierce Global Export Competition from Brazil: A record Brazilian crop—with production raised by 500,000 bales to 19.0 million—continues to aggressively capture market share in key destination markets across Asia and Europe. Lower-priced South American supplies are actively displacing U.S. cotton in traditional import destinations like Turkey, restricting U.S. weekly export sales commitments.
- Accelerating Harvest Pace and Producer Hedge Pressure: U.S. crop progress data indicates that harvesting is advancing faster than historical averages, with over 23% of national acreage completed and major producing zones like Texas ahead of schedule. The ongoing influx of new-crop ginnings into commercial warehouses generates continuous physical supply liquidity and commercial hedge-selling on intraday price spikes.
This article may include AI-generated content that is human-reviewed, which is for reference and general information purposes only and does not constitute investment advice.
Recommended Articles







Comments (0)
Click the $ button, enter the symbol, and select to link a stock, ETF, or other ticker.