


Solana (SOLUSD) Is up 1.26% on Oct 14: Key Drivers to Watch



Solana (SOLUSD) is up 1.26% at Oct 14 04:10(ET), now at $107.48, with a 7-day down of 6.70%.
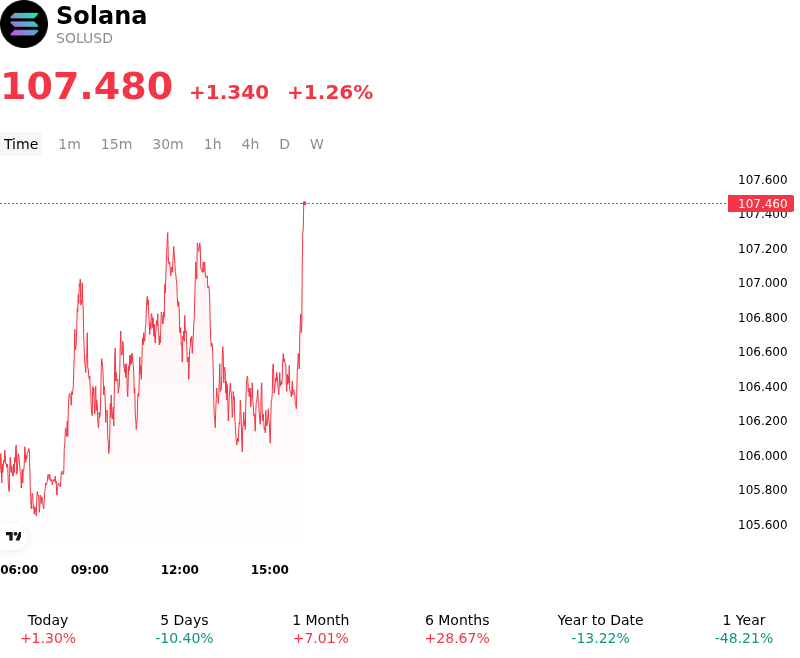
What is driving Solana (SOLUSD)’s stock price up today?
Capital flowed into Solana as market participants re-evaluated growth prospects around near-term network performance enhancements and ecosystem expansion. Sentiment was bolstered by technical developments surrounding the protocol's consensus architecture, specifically forward-looking optimism regarding the Alpenglow upgrade designed to transition the network from TowerBFT to Votor consensus. Anticipation of sub-second transaction finality and optimized validator voting efficiency improved long-term network efficiency and adoption expectations, attracting incremental buy-side interest from institutional and sophisticated crypto investors seeking exposure to high-throughput Layer-1 infrastructure.
Beyond protocol-level upgrades, solidifying on-chain activity and enterprise integration momentum provided underlying fundamental support. Continued growth in decentralized exchange trading volume, robust stablecoin transfer activity, and expanding real-world payment integrations reinforced Solana's competitive positioning relative to rival smart contract platforms. This fundamental resilience, coupled with a stabilization in spot product fund flows and steady institutional positioning, helped re-anchor investor risk appetite following a period of recent market consolidation.
From a market structure perspective, the upward momentum was further accelerated by crypto derivatives positioning and localized liquidity dynamics. A modest expansion in open interest across perpetual futures markets, combined with short-covering activity near key technical support levels, absorbed selling pressure and catalyzed upside price discovery. While macro liquidity conditions and central bank policy expectations continue to dictate broader digital asset volatility, Solana's asset-specific catalysts and strong operational metrics helped drive positive performance during the session.
Technical Analysis of Solana (SOLUSD)
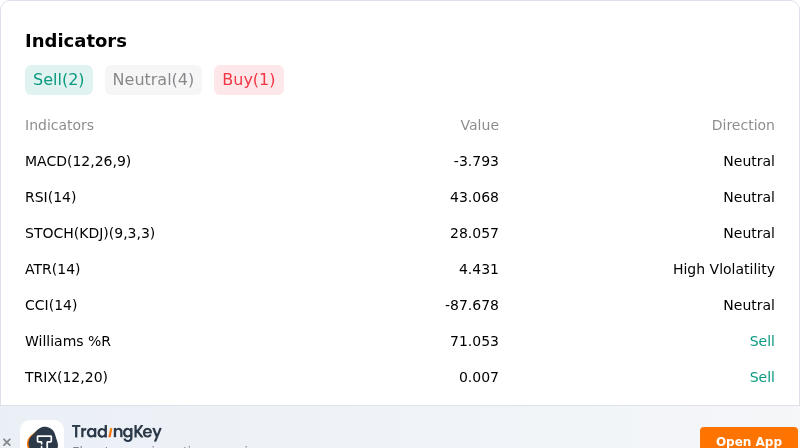
Technically, Solana (SOLUSD) shows a MACD (12,26,9) value of -3.793, indicating a neutral signal. The RSI at 43.068 suggests neutral condition and the Williams %R at 71.053 suggests sell condition. Please monitor closely.
More details about Solana (SOLUSD)
Recent Events and Risks:
- Institutional Capital Reversal: U.S. spot Solana ETFs recorded their largest weekly net outflows since launch, reaching approximately $24.8 million and snapping a 14-week inflow streak to signal a sharp retreat in institutional demand.
- Leverage Unwinds and Long Liquidations: Accelerated deleveraging across major derivatives platforms has triggered millions of dollars in forced long liquidations, amplifying intraday price drops when key support levels fail.
- On-Chain Supply Pressure: Continued programmatic token sales from key ecosystem protocols alongside large whale unstaking transactions add persistent overhead supply that absorbs spot market depth.
- Macro Risk-Off Headwinds: Weakness in broader digital asset markets driven by Bitcoin-led liquidations, elevated bond yields, and macro caution continues to exert downside pressure on high-beta altcoins like Solana.
This article may include AI-generated content that is human-reviewed, which is for reference and general information purposes only and does not constitute investment advice.
Recommended Articles








Comments (0)
Click the $ button, enter the symbol, and select to link a stock, ETF, or other ticker.