


BP PLC Stock (BP) Moved Up by 3.90% on Oct 13: Drivers Behind the Movement



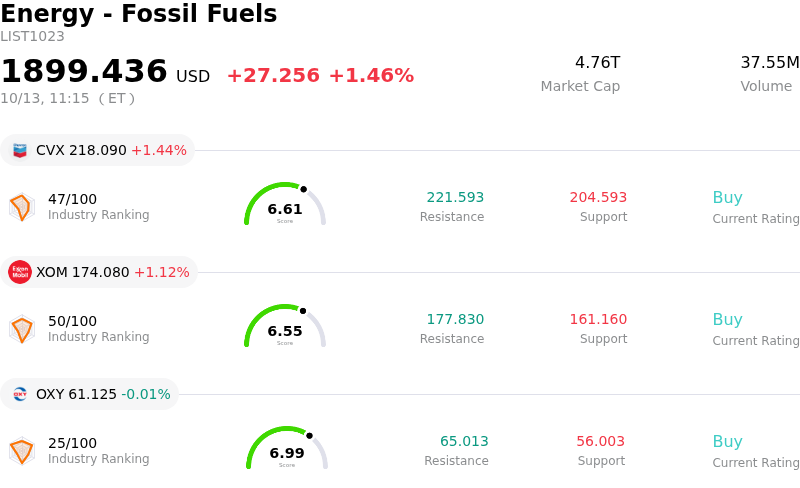
BP PLC (BP) moved up by 3.90%. The Energy - Fossil Fuels sector is up by 1.46%. The company outperformed the industry. Top 3 stocks by turnover in the sector: Chevron Corp (CVX) up 1.44%; Exxon Mobil Corp (XOM) up 1.12%; Occidental Petroleum Corp (OXY) down 0.01%.
What is driving BP PLC (BP)’s stock price up today?
BP experienced a notable upward trajectory as market participants reacted favorably to the energy major's third-quarter trading update. The primary catalyst driving buying interest was a faster-than-anticipated balance sheet cleanup, highlighted by a sharp reduction in net debt that allowed the company to reach its debt-reduction target roughly a year ahead of schedule. Strong operational cash flows, working capital releases, and asset sale proceeds enabled this milestone. Market sentiment was further reinforced by the announcement of an upcoming comprehensive strategy update led by Chief Executive Meg O'Neill, instilling investor confidence in disciplined capital allocation and core operational focus.
Operational metrics for the period showcased powerful fundamental momentum across key segments. BP flagged a substantial surge in its indicative refining margins quarter-over-quarter alongside significantly stronger results in gas marketing and trading. Elevated global crude prices, supported by ongoing geopolitical tension and Middle East supply concerns, provided a potent tailwind for upstream realisations. Investors largely looked past non-cash impairment charges concentrated within the gas and low-carbon transition business, prioritizing instead the robust underlying profitability and cash-generating power of core energy operations.
The positive price action also reflects growing institutional support as financial analysts revised earnings forecasts upward in response to strengthening fundamentals. With reported upstream production remaining stable and leverage metrics improving markedly ahead of schedule, BP has significantly enhanced its financial flexibility. The combination of strong refining spreads, high realized commodity prices, and structural balance sheet improvement reinforces investor optimism regarding earnings resilience and capital return prospects ahead of full quarterly results later this month.
Technical Analysis of BP PLC (BP)
Technically, BP PLC (BP) shows a MACD (12,26,9) value of 0.660, indicating a buy signal. The RSI at 70.191 suggests buy condition and the Williams %R at 0.763 suggests overbought condition. Please monitor closely.
Fundamental Analysis of BP PLC (BP)
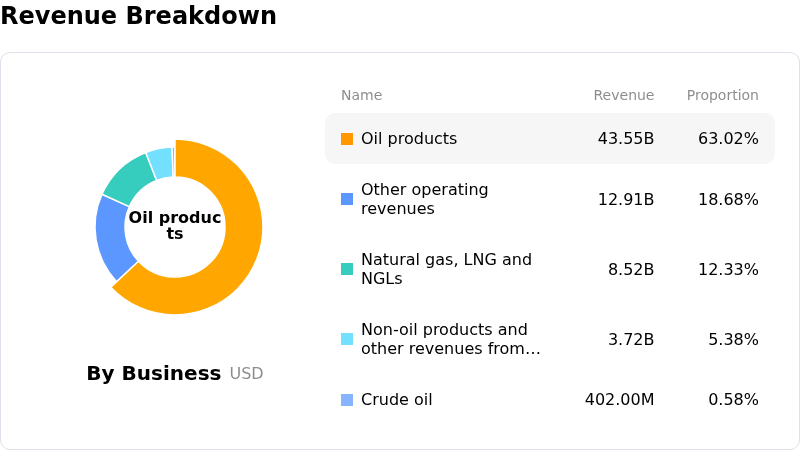
BP PLC (BP) is in the Energy - Fossil Fuels industry. Its latest annual revenue is $189.34B, ranking 3 in the industry. The net profit is $54.00M, ranking 63 in the industry. Company Profile
Over the past month, multiple analysts have rated the company as Buy, with an average price target of $50.73, a high of $64.00, and a low of $41.00.
More details about BP PLC (BP)
Company Specific Risks:
- Substantial Low-Carbon Asset Impairments: BP disclosed in its Q3 2026 trading update expected post-tax impairment charges ranging from $3.0 billion to $4.5 billion, primarily driven by hefty write-downs within its gas and low-carbon transition energy segment as it scales back renewable investments.
- Customer Segment Margin Compression: Earnings in the Customers business unit are facing downside pressure due to narrowing retail fuel margins, elevated base-oil input costs impacting the Castrol brand, and reduced financial contributions from midstream operations.
- Refining Throughput Decline and Operational Vulnerabilities: Expected Q3 refining throughput has slowed to between 1,375 and 1,405 thousand barrels per day (mb/d)—down from 1,467 mb/d in Q2 2026—compounded by slightly lower upstream oil production and temporary Gulf of Mexico platform shut-ins following severe weather.
- Strategic Pivot and Capital Allocation Execution Drag: Rapidly shifting strategy away from low-carbon investments toward core oil and gas assets poses ongoing execution risks, while analysts highlight residual vulnerability to oil price fluctuations and legacy Gulf settlement obligations.
This article may include AI-generated content that is human-reviewed, which is for reference and general information purposes only and does not constitute investment advice.
Recommended Articles









Comments (0)
Click the $ button, enter the symbol, and select to link a stock, ETF, or other ticker.