


XRP (XRPUSD) Is down 2.03% on Oct 13: Key Drivers to Watch



XRP (XRPUSD) is down 2.03% at Oct 13 20:15(ET), now at $1.3393, with a 7-day down of 10.83%.
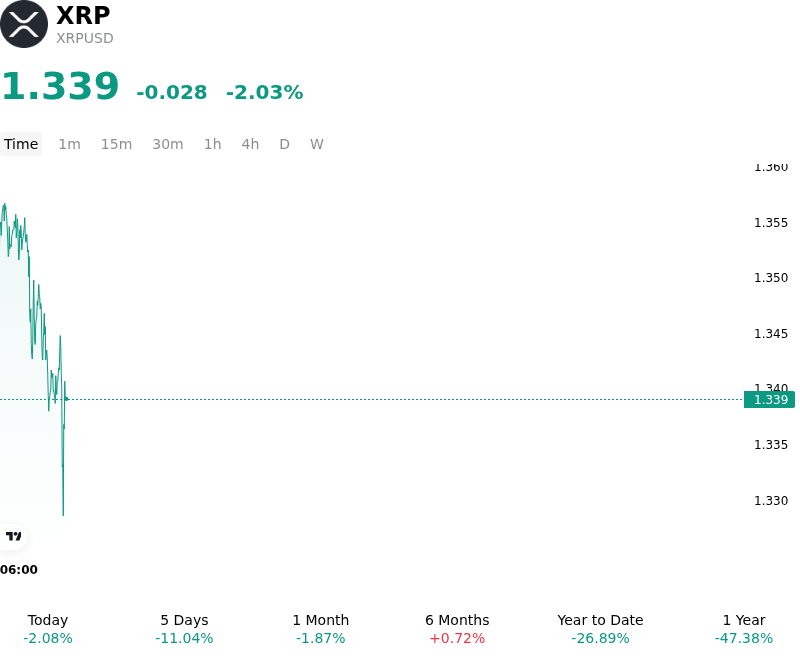
What is driving XRP (XRPUSD)’s stock price down today?
XRP experienced downside pressure as a classic sell-the-news dynamic unfolded following high-profile corporate treasury developments. The Nasdaq debut of Evernorth Holdings, which operates a substantial corporate treasury holding hundreds of millions of XRP tokens, initially generated market attention. However, institutional investors and market participants recognized that the equity listing structure relying on existing token contributions failed to generate direct spot purchasing demand for XRP in the open market. This realization prompted short-term traders to lock in profits following weeks of anticipation, leading to a temporary liquidity withdrawal as speculative enthusiasm dissipated.
The decline was further accelerated by technical support breaches and subsequent derivatives positioning adjustments. As XRP fell below key exponential moving averages and technical support around the $1.40 level, systematic momentum algorithms and sell-stop orders were activated. This breach triggered long liquidations across crypto derivatives venues, compounding spot order book imbalance during the trading session. Additionally, broader digital asset sentiment remained subdued due to macroeconomic uncertainty, fluctuating Treasury yields, and profit-taking across benchmark cryptocurrencies, encouraging risk-off adjustments among institutional desks.
Despite the temporary intraday weakness, structural demand dynamics show persistent institutional participation. Spot XRP exchange-traded funds and exchange-traded products maintained their trend of positive net capital inflows, signaling that long-term asset managers continue to build baseline exposure. Consequently, the intraday price action reflects a healthy short-term positioning reset and derivative deleveraging event rather than a structural deterioration in institutional adoption or ecosystem fundamentals.
Technical Analysis of XRP (XRPUSD)
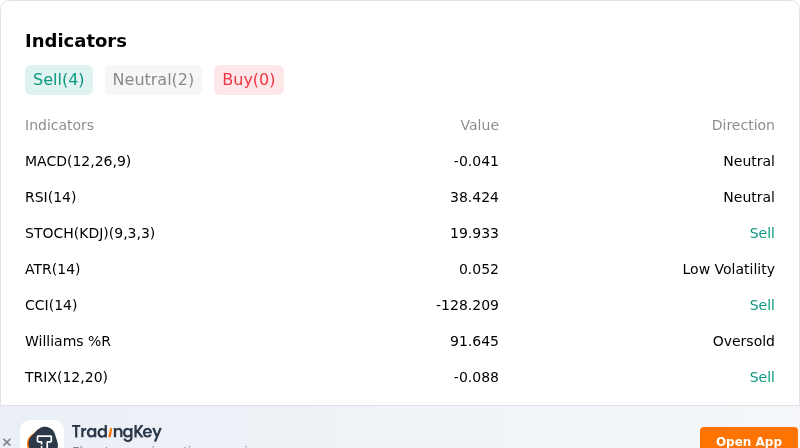
Technically, XRP (XRPUSD) shows a MACD (12,26,9) value of -0.041, indicating a neutral signal. The RSI at 38.469 suggests neutral condition and the Williams %R at 91.433 suggests oversold condition. Please monitor closely.
More details about XRP (XRPUSD)
Recent Events and Risks:
- Derivatives Unwinding and Forced Long Liquidations: A sharp rejection from resistance near $1.51 pushed XRP below key technical support levels around $1.40, triggering over $40 million in forced long position liquidations across major exchanges and compounding downward intraday momentum.
- Plunging Spot Volume and Weak Taker Demand: Spot trading turnover on major platforms fell by nearly 80% alongside declining buyer-initiated volume, revealing a lack of organic spot market demand to confirm price rebounds and leaving order books vulnerable to aggressive sell orders.
- Centralized Exchange Reserve Inflows: On-chain data highlights heavy transfers of XRP onto centralized platforms, with exchange reserves on Binance expanding by over 1.6 billion tokens, significantly increasing liquid sell-side supply overhead.
- Institutional Sell-the-News Market Reaction: The official Nasdaq debut of corporate treasury vehicle Evernorth—holding roughly 473 million XRP—failed to generate immediate open-market spot buy orders, prompting short-term traders to unwind speculative positions and lock in gains.
This article may include AI-generated content that is human-reviewed, which is for reference and general information purposes only and does not constitute investment advice.
Recommended Articles









Comments (0)
Click the $ button, enter the symbol, and select to link a stock, ETF, or other ticker.