


Carvana Co Stock (CVNA) Moved Down by 5.63% on Oct 12: What Signal Does It Send?



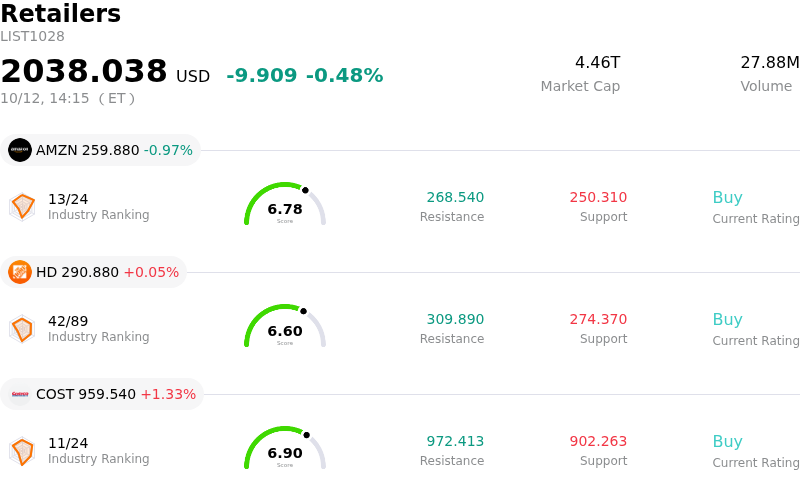
Carvana Co (CVNA) moved down by 5.63%. The Retailers sector is down by 0.48%. The company underperformed the industry. Top 3 stocks by turnover in the sector: Amazon.com Inc (AMZN) down 0.97%; Home Depot Inc (HD) up 0.05%; Costco Wholesale Corp (COST) up 1.33%.
What is driving Carvana Co (CVNA)’s stock price down today?
Carvana experienced significant downward pressure as profit-taking and renewed concerns over unit economics weighed on the stock ahead of its upcoming third-quarter earnings report. Investors are increasingly focusing on the potential compression of gross profit per vehicle, driven by elevated benchmark interest rates and narrowing financing revenues as the company passes rate concessions along to car buyers. The intraday pullback highlights heightened sensitivity to valuation multiples, given that the stock trades at a notable premium relative to traditional automotive retail peers and the broader market.
A primary factor weighing on market sentiment is the trend in per-unit profitability. Analyst updates leading into the earnings date have highlighted consecutive quarters of lower EBITDA per car, raising questions on Wall Street about whether volume expansion can fully offset per-vehicle margin erosion. While top-line retail sales volume has demonstrated steady momentum, lower gain-on-sale margins on origination receivables have prompted select research firms to temper price targets and medium-term profit forecasts. As analysts recalibrate their growth assumptions, the stock's premium valuation leaves limited buffer against profit margin headwinds.
Macroeconomic pressures across the used-vehicle and consumer finance sectors also contributed to today's decline. Persistent interest rate headwinds continue to impact consumer affordability, forcing online used-auto platforms to balance inventory velocity against financing margins. Concurrently, broader sector rotation out of high-beta growth names further amplified the weakness. Moving forward, institutional investors remain focused on Carvana's ability to demonstrate margin stabilization, efficient inventory reconditioning, and sustainable cash flow growth in its upcoming quarterly report.
Technical Analysis of Carvana Co (CVNA)
Technically, Carvana Co (CVNA) shows a MACD (12,26,9) value of -0.107, indicating a sell signal. The RSI at 36.319 suggests neutral condition and the Williams %R at 82.535 suggests oversold condition. Please monitor closely.
Fundamental Analysis of Carvana Co (CVNA)
Carvana Co (CVNA) is in the Retailers industry. Its latest annual revenue is $20.32B, ranking 11 in the industry. The net profit is $1.41B, ranking 7 in the industry. Company Profile
Over the past month, multiple analysts have rated the company as Buy, with an average price target of $81.79, a high of $120.00, and a low of $60.00.
More details about Carvana Co (CVNA)
Company Specific Risks:
- Per-Unit Profitability Compression and H2 Margin Guidance: Recent financial disclosures highlight a sequential decline in Gross Profit per Unit (GPU) caused by narrowing interest rate spreads, higher operational expenses, and reduced financing margins. Management's full-year adjusted EBITDA guidance range of $2.7 billion to $3.0 billion implies a step-down in second-half performance compared to the peak Q2 annualized rate, triggering concerns over profitability durability.
- Institutional Analyst Target Price Downgrades: Wall Street research firms including Barclays and Stephens have recently cut their price targets on CVNA, citing reduced gain-on-sale per unit projections and persistent non-vehicle (Other) GPU compression. These downward adjustments reflect mounting analyst concern over rate-driven margin erosion heading into the upcoming Q3 earnings release.
- Treasury Yield Volatility and Credit Market Vulnerability: Elevated long-term Treasury yields create persistent headwinds for Carvana's rate-sensitive auto-lending model. Rising borrowing costs and tighter consumer financing conditions reduce vehicle affordability and weaken excess spread returns across Carvana's asset-backed securities (ABS) and loan-underwriting channels.
- Insider Equity Liquidation: Recent insider transaction disclosures reveal continued share sales by key executives, including Chief Financial Officer Mark Jenkins selling approximately $3.9 million of CVNA equity. Ongoing insider divestments add downside pressure and heighten investor anxiety regarding top-level confidence amid volatile market conditions.
This article may include AI-generated content that is human-reviewed, which is for reference and general information purposes only and does not constitute investment advice.
Recommended Articles






Comments (0)
Click the $ button, enter the symbol, and select to link a stock, ETF, or other ticker.