


Chevron Corp Stock (CVX) Moved Up by 3.00% on Oct 8: Drivers Behind the Movement



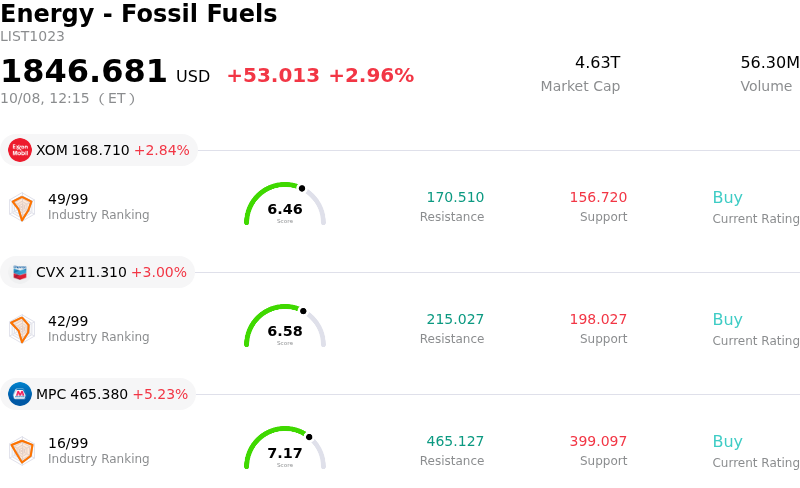
Chevron Corp (CVX) moved up by 3.00%. The Energy - Fossil Fuels sector is up by 2.96%. The company outperformed the industry. Top 3 stocks by turnover in the sector: Exxon Mobil Corp (XOM) up 2.84%; Chevron Corp (CVX) up 3.00%; Marathon Petroleum Corp (MPC) up 5.23%.
What is driving Chevron Corp (CVX)’s stock price up today?
Chevron Corporation experienced notable upward momentum driven primarily by a sharp rally in global crude oil prices, coupled with company-specific strategic initiatives. Benchmark crude prices surged higher as escalating geopolitical tensions in the Middle East raised renewed concerns over regional supply disruptions. Simultaneously, weather-related risks in the Gulf of Mexico forced temporary platform evacuations and production shut-ins across the region, further tightening short-term supply expectations. As an integrated energy titan with heavy upstream exposure, Chevron stands as a direct beneficiary of rising realized oil prices, which significantly lift prospective margins and cash flow generation in its core exploration and production division.
Adding to the positive tone, market sentiment was supported by recent portfolio optimization moves aimed at long-term efficiency. Chevron finalized a strategic restructuring of its midstream agreements in the Bakken basin, exchanging certain equity stakes and assets to lock in substantial long-term midstream cost reductions. While the transaction involves a one-time non-cash accounting charge, market participants viewed the deal favorably due to its ability to meaningfully lower unit operating costs, simplify the balance sheet, and expand future free cash flow potential. Furthermore, recent executive leadership transitions signaling strategic continuity and ongoing capital discipline have reinforced institutional confidence.
Overall, the intraday gains reflect a dual engine of macroeconomic tailwinds from rising commodity prices and constructive corporate execution. While persistent market volatility and broad inflationary pressures tied to energy prices remain key variables, Chevron's structural cost reductions and operational resilience leave it well positioned within the global energy sector.
Technical Analysis of Chevron Corp (CVX)
Technically, Chevron Corp (CVX) shows a MACD (12,26,9) value of -0.362, indicating a neutral signal. The RSI at 58.911 suggests neutral condition and the Williams %R at 4.182 suggests overbought condition. Please monitor closely.
Fundamental Analysis of Chevron Corp (CVX)
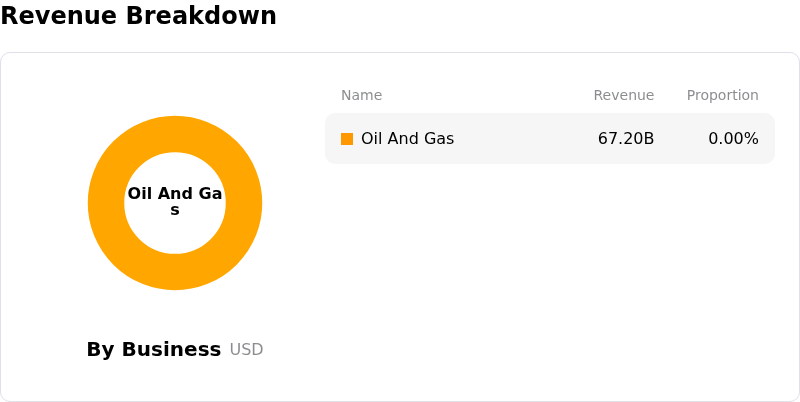
Chevron Corp (CVX) is in the Energy - Fossil Fuels industry. Its latest annual revenue is $184.43B, ranking 4 in the industry. The net profit is $12.30B, ranking 6 in the industry. Company Profile
Over the past month, multiple analysts have rated the company as Buy, with an average price target of $222.70, a high of $250.00, and a low of $175.00.
More details about Chevron Corp (CVX)
Company Specific Risks:
- Significant One-Time Loss Disclosed in SEC 8-K Filing: Chevron filed an SEC Form 8-K disclosing that its transaction to deconsolidate and transfer its ownership interests in Hess Midstream and DJ Basin assets will trigger a one-time after-tax accounting loss estimated between $3 billion and $4 billion upon closing.
- Policy Exposure to Potential Diesel Export Restrictions: Chief Executive Officer Mike Wirth highlighted downstream product supply risks arising from proposed U.S. diesel export restrictions, which threaten to disrupt fuel trade routes and compress refining segment margins.
- Gulf of Mexico Production Shutdowns from Hurricane Disruption: Precautionary operational suspensions across the U.S. Gulf of Mexico caused by Hurricane Isaias led to regional production shut-ins of approximately 511,000 barrels per day, creating short-term output and cash-flow headwinds for Chevron.
- Constrained Share Buyback Execution and Soft Momentum: Executive management confirmed that share repurchases will remain restricted to the lower end of its $10 billion to $20 billion annual target range ($2.5 billion to $3.0 billion quarterly) due to oil price volatility, while technical indicators point to intraday seller control.
This article may include AI-generated content that is human-reviewed, which is for reference and general information purposes only and does not constitute investment advice.
Recommended Articles









Comments (0)
Click the $ button, enter the symbol, and select to link a stock, ETF, or other ticker.