


Pershing Square Ord Shs Stock (PS) Moved Up by 7.51% on Oct 6: What Investors Need To Know



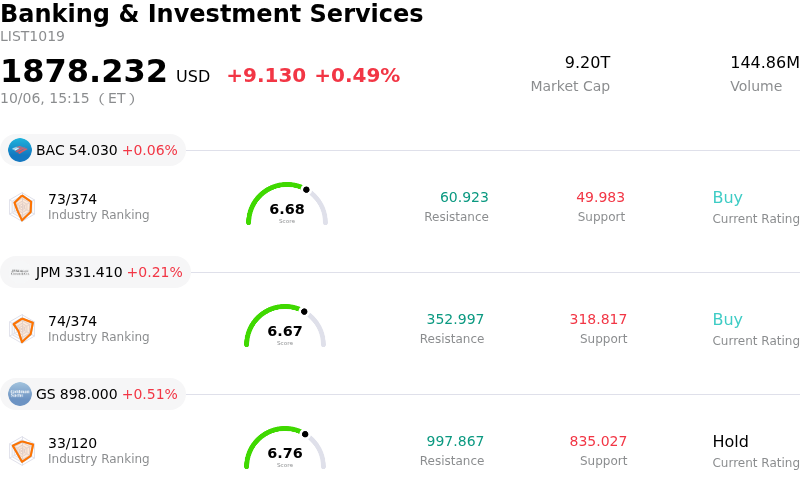
Pershing Square Ord Shs (PS) moved up by 7.51%. The Banking & Investment Services sector is up by 0.49%. The company outperformed the industry. Top 3 stocks by turnover in the sector: Bank of America Corp (BAC) up 0.06%; JPMorgan Chase & Co (JPM) up 0.21%; Goldman Sachs Group Inc (GS) up 0.51%.
What is driving Pershing Square Ord Shs (PS)’s stock price up today?
Pershing Square experienced a sharp upward move during the trading session, driven by renewed buyer enthusiasm and sustained momentum surrounding the asset manager's growth initiatives. The company has attracted strong market attention, bolstered by its expanding permanent-capital base and steady growth in fee-paying assets under management across its concentrated portfolio strategies.
A primary catalyst supporting sentiment is the strategic rollout of new permanent-capital structures and fund management initiatives, such as Pershing Square Ventures, alongside leverage optimization across its closed-end vehicles. Furthermore, the company's recent dividend declaration provided clarity around its capital allocation framework, reassuring income-focused investors and underscoring management's focus on returning capital to shareholders.
Wall Street sentiment has also shown signs of incremental recalibration. Recent upward price target revisions from research firms reflect growing recognition of the firm's long-term fee-generation capacity, even as analysts maintain an overall balanced outlook given elevated valuation metrics. Robust buying interest and technical momentum ultimately outpaced lingering market concerns regarding valuation multiples and future float adjustments, fueling strong intraday buying activity and lifting the shares significantly higher.
Technical Analysis of Pershing Square Ord Shs (PS)
Technically, Pershing Square Ord Shs (PS) shows a MACD (12,26,9) value of 1.029, indicating a buy signal. The RSI at 66.947 suggests neutral condition and the Williams %R at 4.724 suggests overbought condition. Please monitor closely.
Fundamental Analysis of Pershing Square Ord Shs (PS)
Pershing Square Ord Shs (PS) is in the Banking & Investment Services industry. Its latest annual revenue is $348.77M, ranking 86 in the industry. The net profit is $249.78M, ranking 54 in the industry. Company Profile
Over the past month, multiple analysts have rated the company as Hold, with an average price target of $43.44, a high of $54.00, and a low of $38.00.
More details about Pershing Square Ord Shs (PS)
Company Specific Risks:
- Analyst Downgrades and Valuation Strain: Wall Street coverage initiations, including an Underweight rating from Wells Fargo with a $41 price target and a downgrade to Hold from JonesTrading, underscore growing institutional concern over an inflated Price-to-Sales multiple exceeding 30x.
- Impending Public Float Expansion: A scheduled increase in the company's public float in late October 2026 presents a major supply overhang, threatening equity dilution and heightened selling pressure post-IPO.
- Surging Short Borrow Costs: Market tracking shows a 126.8% surge in indicative short-borrow rates, signaling a sharp rise in short-seller demand and institutional hedging against near-term downside volatility.
- Bottom-Line Losses and High Cost Absorption: Financial disclosures highlight ongoing profitability weaknesses, including a $190.3 million net loss for the first half of 2026 driven by elevated transaction expenses, fee amortization, and negative net margins.
This article may include AI-generated content that is human-reviewed, which is for reference and general information purposes only and does not constitute investment advice.
Recommended Articles








Comments (0)
Click the $ button, enter the symbol, and select to link a stock, ETF, or other ticker.