


Paychex Inc Stock (PAYX) Moved Down by 7.07% on Sep 23: What Signal Does It Send?



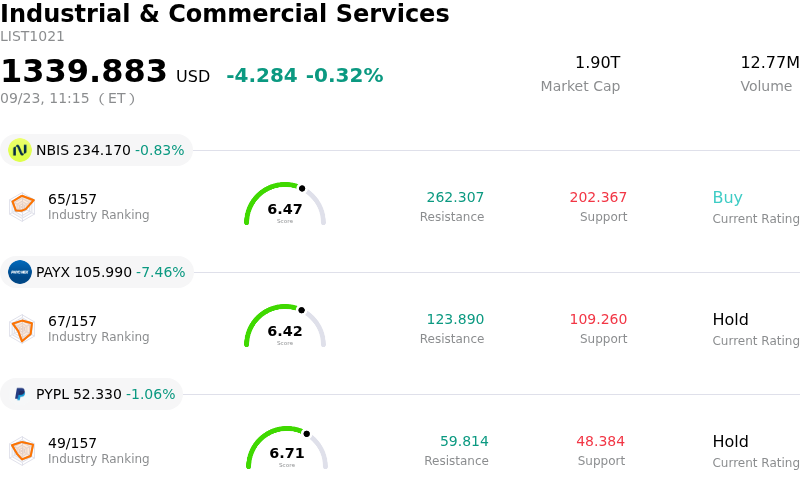
Paychex Inc (PAYX) moved down by 7.07%. The Industrial & Commercial Services sector is down by 0.32%. The company underperformed the industry. Top 3 stocks by turnover in the sector: Nebius Group NV (NBIS) down 0.83%; Paychex Inc (PAYX) down 7.46%; PayPal Holdings Inc (PYPL) down 1.02%.
What is driving Paychex Inc (PAYX)’s stock price down today?
Paychex experienced notable downward pressure following the release of its first-quarter fiscal 2027 financial results. Although the human capital management solutions provider delivered top-line revenue in line with consensus expectations and posted an adjusted earnings beat supported by operating margin expansion, investor reaction turned negative. The primary source of disappointment centered on the company's core Management Solutions segment, where revenue growth showed modest softness compared to elevated market expectations. Additionally, a sequential contraction in free cash flow conversion and lower operating cash flow relative to the prior-year period weighed heavily on market sentiment, drawing focus away from headline profitability.
Market disappointment was further amplified by management’s decision to largely maintain its full-year fiscal 2027 financial outlook. While the company raised guidance for its Professional Employer Organization and Insurance Solutions division, it left overall total revenue and adjusted earnings per share growth projections unchanged. Given the stock's premium valuation metrics entering the earnings release, market participants had anticipated a broader full-year guidance raise driven by first-quarter execution. The absence of upward revisions to primary revenue drivers fueled skepticism regarding organic growth acceleration among small and midsize business clients, particularly in an environment where SMB hiring trends remain temperate.
Despite positive operational developments, including the launch of new artificial intelligence-native recruiting tools and continued execution on cost efficiency initiatives following recent integration efforts, valuation sensitivities prevailed. Institutional investors appeared to rebalance exposure in response to long-term top-line growth trends that lag broader software sector benchmarks. As a result, the market prioritized elevated valuation multiples, softer core payroll momentum, and cash flow normalization over short-term operating margin gains, leading to significant intraday selling pressure.
Technical Analysis of Paychex Inc (PAYX)
Technically, Paychex Inc (PAYX) shows a MACD (12,26,9) value of -2.749, indicating a sell signal. The RSI at 26.225 suggests sell condition and the Williams %R at 88.552 suggests oversold condition. Please monitor closely.
Fundamental Analysis of Paychex Inc (PAYX)
Paychex Inc (PAYX) is in the Industrial & Commercial Services industry. Its latest annual revenue is $6.51B, ranking 20 in the industry. The net profit is $1.76B, ranking 10 in the industry. Company Profile
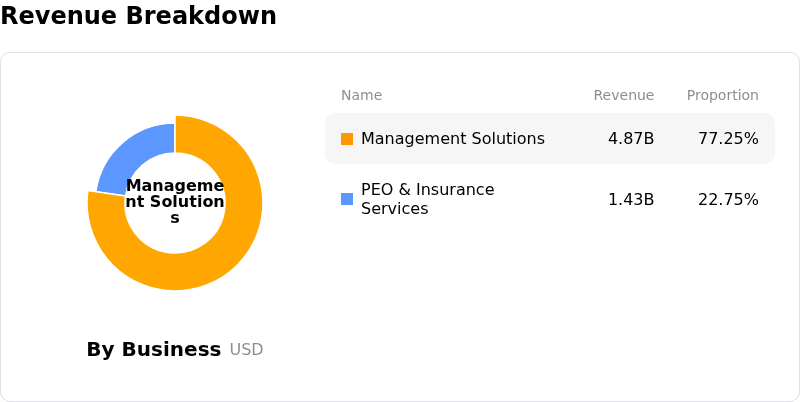
Over the past month, multiple analysts have rated the company as Hold, with an average price target of $120.36, a high of $150.00, and a low of $103.00.
More details about Paychex Inc (PAYX)
Company Specific Risks:
- Sequential Free Cash Flow Margin Compression: Paychex reported a sharp sequential contraction in its free cash flow margin to 21.9% in its Q1 FY2027 financial results, down from 32.1% in the prior quarter, triggering institutional concern regarding near-term cash conversion efficiency.
- Core Management Solutions Revenue Deceleration: Top-line expansion in the core Management Solutions segment slowed to 4% year-over-year ($1.20 billion), indicating persistent softness in organic client additions and cautious hiring trends among small and medium-sized business accounts.
- Paycor Integration and Margin Execution Risks: Analyst commentary following the earnings report emphasized elevated execution and integration costs related to the Paycor deal, which threaten to weigh on operating margins and delay projected cost synergy realizations.
- Earnings Quality Reliance on Client Float Income: Profitability expansion in the quarter was heavily supported by interest income earned on client funds ($49.8 million) and expense discipline rather than organic revenue outperformance, leaving earnings vulnerable to macroeconomic interest rate cuts.
This article may include AI-generated content that is human-reviewed, which is for reference and general information purposes only and does not constitute investment advice.
Recommended Articles









Comments (0)
Click the $ button, enter the symbol, and select to link a stock, ETF, or other ticker.