


JPMorgan Chase & Co Stock (JPM) Moved Down by 4.00% on Sep 22: Drivers Behind the Movement



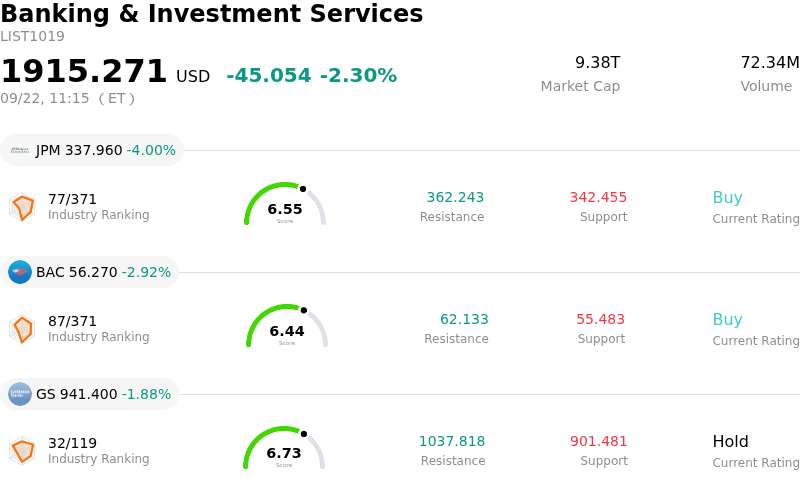
JPMorgan Chase & Co (JPM) moved down by 4.00%. The Banking & Investment Services sector is down by 2.30%. The company underperformed the industry. Top 3 stocks by turnover in the sector: JPMorgan Chase & Co (JPM) down 4.00%; Bank of America Corp (BAC) down 2.92%; Goldman Sachs Group Inc (GS) down 1.88%.
What is driving JPMorgan Chase & Co (JPM)’s stock price down today?
JPMorgan Chase experienced downward pressure as broader equity markets faced heightened intraday volatility, particularly among major components of the financial sector. The pullback in bank shares reflects broader macroeconomic shifts as investors re-evaluate rate policy expectations and the outlook for bank profit margins following recent central bank monetary decisions. After a sustained period of outperformance across large-cap financial institutions, market participants appear to be engaging in profit-taking ahead of the upcoming third-quarter earnings season.
A primary catalyst driving the cautious sentiment around major lenders is the growing expectation that net interest income growth may be reaching a cyclical plateau. As deposit costs catch up to loan repricing and yield curves adjust, net interest margin expansion is becoming increasingly constrained. Furthermore, institutional investors are carefully scrutinizing credit quality metrics, particularly in consumer lending portfolios and commercial credit books, where rising loss provisions and credit card charge-offs could temper forward profitability estimates.
Additionally, ongoing discussions regarding regulatory capital frameworks and Federal Reserve stress test methodologies continue to create short-term sentiment fluctuations around capital return capabilities. While JPMorgan Chase maintains industry-leading balance sheet strength, robust asset management expansion, and strong franchise diversification, the stock's near-term performance remains sensitive to broader sector rotation, profit-taking, and evolving macroeconomic projections.
Technical Analysis of JPMorgan Chase & Co (JPM)
Technically, JPMorgan Chase & Co (JPM) shows a MACD (12,26,9) value of -3.186, indicating a sell signal. The RSI at 34.371 suggests neutral condition and the Williams %R at 99.140 suggests oversold condition. Please monitor closely.
Media Coverage of JPMorgan Chase & Co (JPM)
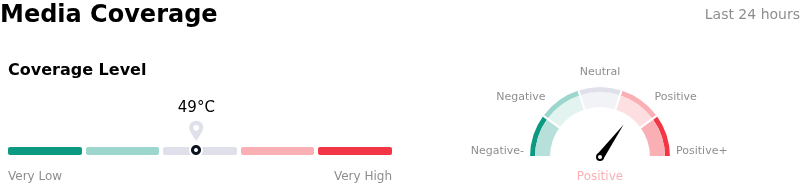
In terms of media coverage, JPMorgan Chase & Co (JPM) shows a coverage score of 49, indicating a moderate level of media attention. The overall market sentiment index is currently in bullish zone.
Fundamental Analysis of JPMorgan Chase & Co (JPM)
JPMorgan Chase & Co (JPM) is in the Banking & Investment Services industry. Its latest annual revenue is $181.82B, ranking 1 in the industry. The net profit is $55.68B, ranking 1 in the industry. Company Profile
Over the past month, multiple analysts have rated the company as Buy, with an average price target of $373.51, a high of $436.00, and a low of $305.00.
More details about JPMorgan Chase & Co (JPM)
Company Specific Risks:
- Escalating Expense Guidance and Margin Compression: Management's full-year non-interest expense projections reaching elevated targets of $105 billion to $107.5 billion—driven by heavy technology investments and operational cost inflation—outpace underlying revenue growth, triggering institutional concerns over operating leverage and Return on Equity (ROE) compression.
- Regulatory Capital Overhang and G-SIB Surcharges: Evolving Federal Reserve annual stress test recalibrations and projected multi-billion-dollar Global Systemically Important Bank (G-SIB) capital surcharge requirements create significant regulatory headwinds, constraining share buybacks and capping returns on equity.
- Net Interest Income (NII) Sensitivity: Shifting Federal Reserve rate expectations and persistent deposit competition continue to pressure core Net Interest Income, leaving bank earnings vulnerable to margin compression if asset yields reprice lower faster than funding costs.
- Consumer Credit Normalization and Loan Provisions: Depleted post-pandemic savings buffers among retail cohorts and normalizing credit trends are driving higher net charge-offs in credit card and retail banking segments, forcing elevated credit loss provisioning.
This article may include AI-generated content that is human-reviewed, which is for reference and general information purposes only and does not constitute investment advice.
Recommended Articles








Comments (0)
Click the $ button, enter the symbol, and select to link a stock, ETF, or other ticker.