


Valero Energy Corp Stock (VLO) Opened Down by 3.16% on Sep 22: What Signal Does It Send?



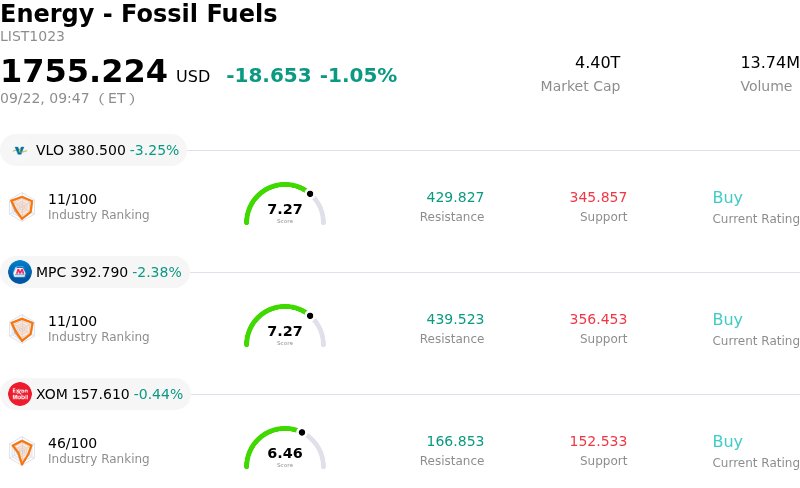
Valero Energy Corp (VLO) opened down by 3.16%. The Energy - Fossil Fuels sector is down by 1.05%. The company underperformed the industry. Top 3 stocks by turnover in the sector: Valero Energy Corp (VLO) down 3.12%; Marathon Petroleum Corp (MPC) down 2.38%; Exxon Mobil Corp (XOM) down 0.39%.
What is driving Valero Energy Corp (VLO)’s stock price down today?
Valero Energy Corporation experienced downward pressure during the session as market participants engaged in profit-taking following a prolonged period of sector outperformance. Shares encountered momentum selling after reaching multi-month highs, driven by investor re-evaluations of stock valuations and short-term earnings expectations. This retreat reflects a broader shift across independent refiners as the market balances elevated refined product margins against recent fluctuations in crude feedstock costs.
While refined product demand and distillate crack spreads remain elevated due to global supply tightness and regional refinery constraints, recent dynamics in upstream crude markets have introduced margin compression fears. Fluctuations in benchmark crude prices, alongside narrowing spreads between heavy sour feedstocks and light sweet crudes, present potential headwind risks to complex Gulf Coast refining operators. Investors are closely monitoring whether refined product prices can maintain their premium relative to raw crude input costs.
From an institutional strategy perspective, the pullback appears primarily driven by tactical portfolio rebalancing and valuation adjustments rather than fundamental deterioration in refining capacity. With third-quarter earnings announcements approaching, institutional market participants are exercising caution and locking in gains from recent rallies. Going forward, key indicators to monitor include refinery utilization rates, global inventory levels, and management's guidance on capital allocation and cash flow distribution.
Technical Analysis of Valero Energy Corp (VLO)
Technically, Valero Energy Corp (VLO) shows a MACD (12,26,9) value of -2.239, indicating a neutral signal. The RSI at 55.759 suggests neutral condition and the Williams %R at 63.893 suggests sell condition. Please monitor closely.
Media Coverage of Valero Energy Corp (VLO)
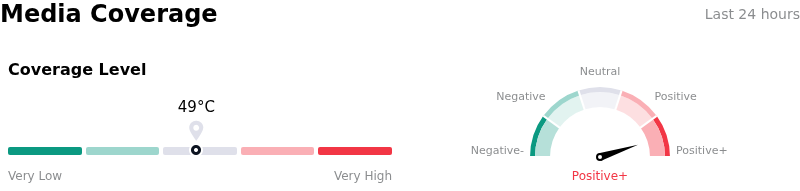
In terms of media coverage, Valero Energy Corp (VLO) shows a coverage score of 49, indicating a moderate level of media attention. The overall market sentiment index is currently in extremely bullish zone.
Fundamental Analysis of Valero Energy Corp (VLO)
Valero Energy Corp (VLO) is in the Energy - Fossil Fuels industry. Its latest annual revenue is $115.97B, ranking 8 in the industry. The net profit is $2.34B, ranking 18 in the industry. Company Profile
Over the past month, multiple analysts have rated the company as Buy, with an average price target of $337.47, a high of $450.00, and a low of $193.45.
More details about Valero Energy Corp (VLO)
Company Specific Risks:
- Analyst Downgrades and Overextended Valuation: On September 22, 2026, Jefferies downgraded Valero Energy to Hold from Buy, citing an unfavorable risk-reward balance at current share prices. Analysts noted that current market pricing unrealistically assumes elevated refining margins through 2029 while ignoring emerging threats of diesel demand destruction.
- Input Cost Inflation and Crack Spread Compression: Rapidly rising benchmark crude oil prices alongside a narrowing spread between heavy sour and light sweet crudes are driving up feedstock costs. This input cost inflation threatens to compress Valero's core refining margins if downstream product prices fail to keep pace or trigger demand destruction.
- Intraday Profit-Taking and Technical Pullback: Following a multi-month rally that drove the stock up over 140% year-to-date to record highs, shares suffered a sharp intraday decline of nearly 5%. Institutional profit-taking and broader energy sector rotation have intensified as technical indicators signal overbought conditions relative to historical mid-cycle valuations.
- Corporate Overhead Expansion Against Revenue Headwinds: A Form 8-K filing released on September 18, 2026, confirmed board expansion and approved increases to non-employee director cash retainers and equity grants. Adding fixed administrative overhead occurs precisely as long-term consensus forecasts project declining annual revenues as peak refining throughput and utilization levels normalize.
This article may include AI-generated content that is human-reviewed, which is for reference and general information purposes only and does not constitute investment advice.
Recommended Articles








Comments (0)
Click the $ button, enter the symbol, and select to link a stock, ETF, or other ticker.