


XRP (XRPUSD) Is down 1.27% on Sep 22: Here Is Why



XRP (XRPUSD) is down 1.27% at Sep 22 21:15(ET), now at $1.5133, with a 7-day up of 16.98%.
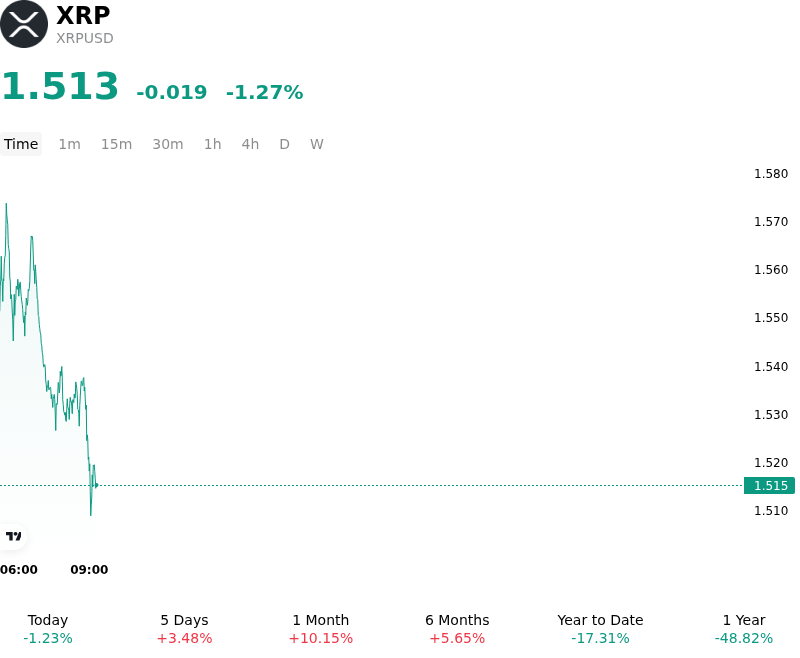
What is driving XRP (XRPUSD)’s stock price down today?
The intraday pullback in XRP primarily reflects localized profit-taking and technical consolidation following a sharp multi-day advance toward key overhead resistance levels. After absorbing substantial spot inflows and large-scale accumulation from high-net-worth market participants over prior sessions, the asset encountered selling friction as tactical traders locked in gains near historic supply concentrations. This modest retrenchment was amplified by derivatives positioning, where elevated open interest and two-way liquidation risks led to a temporary unwinding of leveraged long positions as upward momentum began to stall.
Capital flow patterns and exchange mechanics also played a central role in moderating price momentum. Recent on-chain data revealed a marked increase in token deposits onto centralized trading venues, signaling elevated two-way turnover and institutional repositioning rather than outright distress. Concurrently, global macro conditions contributed to a temporary pause across digital asset risk sentiment as market participants digested recent shifts in Treasury yields, foreign exchange volatility, and global monetary policy expectations, which slowed the immediate velocity of incoming capital into high-beta altcoins.
From a structural perspective, the price adjustment appears to be an event-driven technical breather within a broader recovery trend, rather than a fundamental deterioration in the token's institutional investment case. Market sentiment remains anchored by long-term tailwinds, including progress on protocol upgrades designed to enhance ledger throughput and ongoing enterprise cross-border payment integration efforts. Investors continue to monitor key macroeconomic liquidity conditions, regulatory implementation timelines, and leverage levels in perpetual futures markets as potential catalysts for renewed volatility.
Technical Analysis of XRP (XRPUSD)
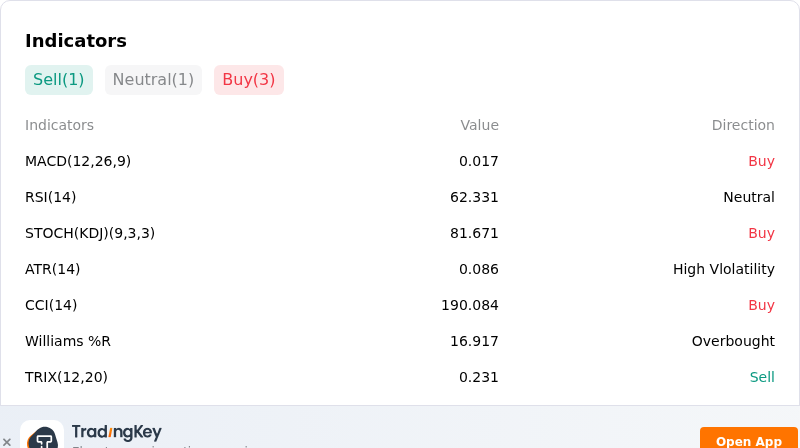
Technically, XRP (XRPUSD) shows a MACD (12,26,9) value of 0.017, indicating a buy signal. The RSI at 62.331 suggests neutral condition and the Williams %R at 16.917 suggests overbought condition. Please monitor closely.
More details about XRP (XRPUSD)
Recent Events and Risks:
- Legislative Setbacks and Regulatory Uncertainty: The U.S. Senate's failure to advance the Digital Asset Market CLARITY Act in a procedural vote eliminated an anticipated federal statutory framework for digital commodities, leaving XRP's regulatory status reliant on temporary agency interpretations and renewing policy vulnerability across U.S. spot markets.
- Whale Inflows and Overhead Exchange Resistance: On-chain data indicates cumulative 30-day XRP deposits to Binance reached approximately 1.6 billion tokens, coinciding with dense sell-order clusters on major exchange order books near $1.45–$1.50 that create substantial overhead supply pressure.
- Leveraged Long Liquidations and Negative Funding: Sharp intraday price rejections triggered over $40 million in long position liquidations across major perpetual exchanges, pushing funding rates negative and increasing the risk of stop-loss cascades if key technical support between $1.36 and $1.37 breaks down.
- Cooling Institutional Demand and ETF Outflows: U.S. spot XRP ETFs recorded a single-day net outflow of $5.15 million while weekly fund inflows slowed markedly from prior levels, signaling a transient tightening in institutional risk appetite following macroeconomic monetary tightening.
This article may include AI-generated content that is human-reviewed, which is for reference and general information purposes only and does not constitute investment advice.
Recommended Articles








Comments (0)
Click the $ button, enter the symbol, and select to link a stock, ETF, or other ticker.