


Amphenol Corp Stock (APH) Moved Up by 3.92% on Sep 21: Drivers Behind the Movement



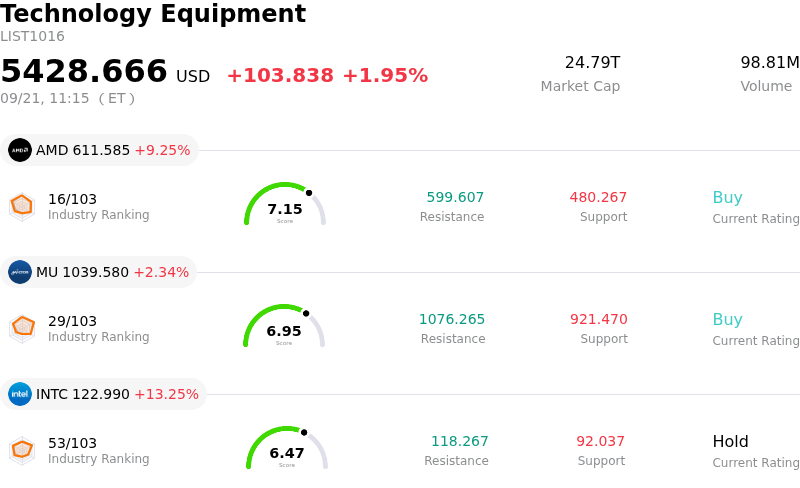
Amphenol Corp (APH) moved up by 3.92%. The Technology Equipment sector is up by 1.95%. The company outperformed the industry. Top 3 stocks by turnover in the sector: Advanced Micro Devices Inc (AMD) up 9.20%; Micron Technology Inc (MU) up 2.34%; Intel Corp (INTC) up 13.27%.
What is driving Amphenol Corp (APH)’s stock price up today?
Amphenol Corporation recorded a notable upward price movement accompanied by heightened intraday volatility, driven primarily by a broader sector rebound across artificial intelligence infrastructure names and renewed buying interest ahead of the company's upcoming ex-dividend date. Investors stepped back into high-speed interconnect and data center connectivity stocks following recent technical pullbacks. Positive institutional sentiment surrounding Amphenol's expanding AI infrastructure footprint, reinforced by robust AI-related revenue momentum across its IT datacom and communications solutions segments, provided strong fundamental tailwinds that attracted dip-buyers back to the stock.
Fundamental catalysts continue to bolster market enthusiasm, particularly following recent management presentations at industry conferences that highlighted rapid expansion in high-speed cables, connectors, and power solutions for next-generation data centers. The strategic integration of recent acquisitions, including key assets from CommScope, is expected to further enhance Amphenol's market share and capacity to serve major cloud hyperscalers. Additionally, Wall Street analysts maintain a constructive long-term outlook on the company, citing sustained double-digit growth potential, upwardly revised earnings estimates, and premium valuation support derived from its top-tier market position.
From a technical perspective, the stock's performance reflected a sharp rebound from short-term oversold indicators, with elevated trading volume pointing to active institutional accumulation. The imminent ex-dividend date created a tactical catalyst for short-term buyers seeking to secure income before the cutoff. Although elevated valuation multiples, potential integration costs, and broader macroeconomic fluctuations in interest rates continue to generate intraday price swings, the fundamental narrative remains tightly anchored to long-term capital deployment in AI infrastructure and global connectivity networks.
Technical Analysis of Amphenol Corp (APH)
Technically, Amphenol Corp (APH) shows a MACD (12,26,9) value of -0.477, indicating a sell signal. The RSI at 51.088 suggests neutral condition and the Williams %R at 51.873 suggests neutral condition. Please monitor closely.
Media Coverage of Amphenol Corp (APH)
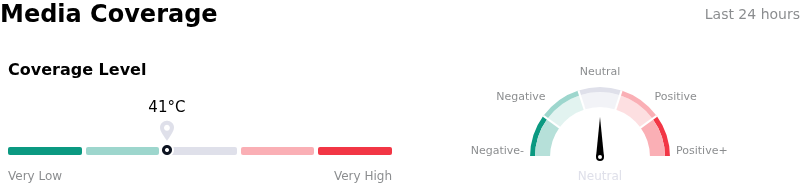
In terms of media coverage, Amphenol Corp (APH) shows a coverage score of 41, indicating a moderate level of media attention. The overall market sentiment index is currently in neutral zone.
Fundamental Analysis of Amphenol Corp (APH)
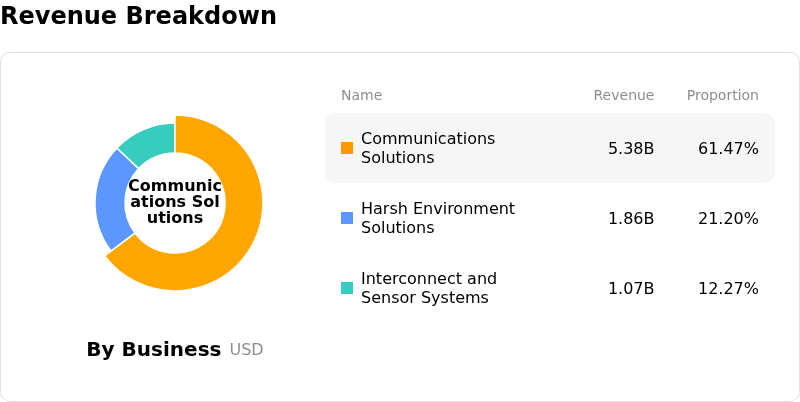
Amphenol Corp (APH) is in the Technology Equipment industry. Its latest annual revenue is $23.09B, ranking 4 in the industry. The net profit is $4.27B, ranking 1 in the industry. Company Profile
Over the past month, multiple analysts have rated the company as Buy, with an average price target of $98.79, a high of $115.00, and a low of $85.00.
More details about Amphenol Corp (APH)
Company Specific Risks:
- Elevated Valuation Multiple and Analyst Target Reductions: Amphenol's premium valuation of nearly 39x P/E has triggered valuation concerns, leading sell-side research firms, including TD Cowen, to lower price targets and express concern that near-term AI data-center infrastructure growth is already fully priced in.
- Surge in Bearish Options Activity: Institutional sentiment has weakened as evidenced by an unusual spike in put option volume—rising over 100% above average daily levels—indicating that large market participants are actively hedging against further intraday price drops.
- Deteriorating Technical Indicators and Sell Signals: The stock has suffered technical breakdowns below short- and long-term moving averages alongside increased trading volume on down days, driving algorithmic momentum selling and heightened intraday volatility.
- Acquisition Integration Risks and Post-Split Share Digestion: Following the formal completion of its two-for-one stock split (disclosed via Form 8-K) and the integration of CommScope’s CCS division, the company faces elevated operational execution and margin risks while attempting to sustain capital efficiency.
This article may include AI-generated content that is human-reviewed, which is for reference and general information purposes only and does not constitute investment advice.
Recommended Articles









Comments (0)
Click the $ button, enter the symbol, and select to link a stock, ETF, or other ticker.