


Elevance Health Inc Stock (ELV) Moved Up by 5.50% on Sep 10: Drivers Behind the Movement



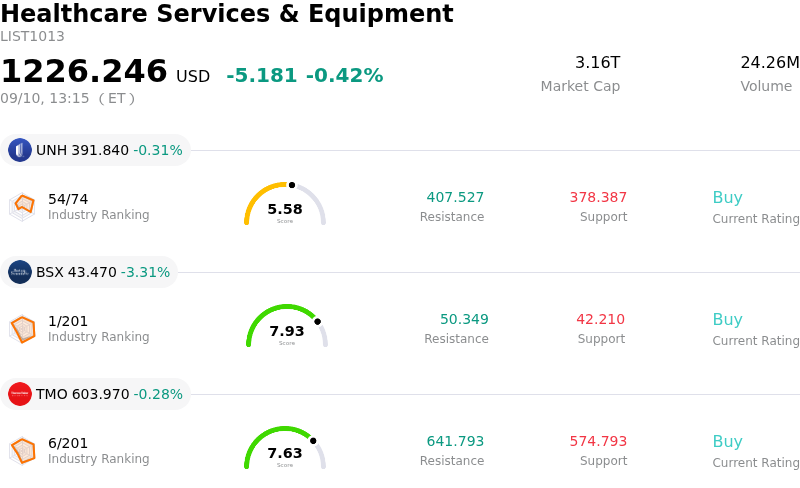
Elevance Health Inc (ELV) moved up by 5.50%. The Healthcare Services & Equipment sector is down by 0.42%. The company outperformed the industry. Top 3 stocks by turnover in the sector: Unitedhealth Group Inc (UNH) down 0.31%; Boston Scientific Corp (BSX) down 3.31%; Thermo Fisher Scientific Inc (TMO) down 0.23%.
What is driving Elevance Health Inc (ELV)’s stock price up today?
Elevance Health experienced strong upward momentum following positive corporate updates and reassuring management comments delivered at an industry healthcare conference. The primary catalyst for the stock rally was executive commentary indicating that third-quarter adjusted earnings are currently tracking ahead of the company's previous guidance. Management reaffirmed its full-year earnings expectations, projecting solid adjusted earnings per share alongside a stable benefit expense ratio. This operational clarity provided immediate relief to investors who had been closely monitoring potential medical cost pressures across the managed care sector.
Beyond near-term execution, investor sentiment was bolstered by an encouraging multi-year growth outlook. Leadership highlighted that the current fiscal year represents the trough for Medicaid margins, paving the way for operational recovery as state reimbursement rates better align with underlying care trends. Furthermore, steady performance in Medicare Advantage, disciplined pricing, and accelerated growth within the Carelon health services segment enabled management to project attractive double-digit earnings growth for the subsequent fiscal year. Strategic portfolio adjustments, including exiting less profitable Medicaid agreements, further underscored executive focus on long-term margin preservation.
The positive price action reflects renewed market confidence in Elevance Health's business model resilience and pricing discipline. By delivering clear evidence of effective cost management and strategic execution, the company effectively alleviated broader industry concerns regarding elevated utilization rates. The optimistic financial commentary and sustained earnings visibility continue to support an improving investment thesis for institutional investors seeking defensive growth in the health benefits sector.
Technical Analysis of Elevance Health Inc (ELV)
Technically, Elevance Health Inc (ELV) shows a MACD (12,26,9) value of 1.869, indicating a buy signal. The RSI at 60.937 suggests neutral condition and the Williams %R at 10.541 suggests overbought condition. Please monitor closely.
Fundamental Analysis of Elevance Health Inc (ELV)
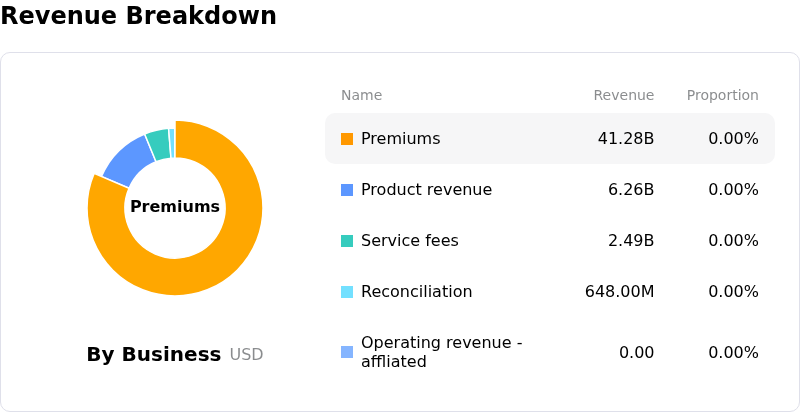
Elevance Health Inc (ELV) is in the Healthcare Services & Equipment industry. Its latest annual revenue is $199.12B, ranking 4 in the industry. The net profit is $5.66B, ranking 4 in the industry. Company Profile
Over the past month, multiple analysts have rated the company as Buy, with an average price target of $446.78, a high of $492.00, and a low of $393.00.
More details about Elevance Health Inc (ELV)
Company Specific Risks:
- Elevated Commercial Medical Costs and IDR Arbitrations: Management highlighted at an industry conference that commercial medical cost trends remain under severe pressure from high utilization in outpatient surgery, specialty pharmacy, and behavioral health, compounded by Independent Dispute Resolution (IDR) cases where providers prevail in about 85% of disputes with awards averaging eight times in-network rates.
- Negative Medicaid Operating Margins and Market Withdrawals: Elevance continues to battle compressed Medicaid operating margins projected at -1.75% for full-year 2026 due to a disconnect between state reimbursement rates and member care utilization, forcing the company to exit unprofitable markets like Washington, D.C., and evaluate further state contract exits over the next 12 to 18 months.
- High Medical Benefit Ratio and Substantial Unfavorable Charges: In a Form 8-K filing, officers reaffirmed a high full-year 2026 benefit expense ratio guidance of 90.2% and a GAAP earnings target of $20.10 per share, which includes approximately $6.90 per share in net unfavorable adjustment items, highlighting ongoing operational costs and net earnings drag.
- Analyst Caution and Government Segment Volatility: Institutional analysts, including RBC Capital adjusting its price target down to $424, remain cautious regarding the lengthy 12-to-18-month execution timeline required to turn around Medicaid profitability and stabilize membership numbers following prior contraction in government-sponsored programs.
This article may include AI-generated content that is human-reviewed, which is for reference and general information purposes only and does not constitute investment advice.
Recommended Articles







Comments (0)
Click the $ button, enter the symbol, and select to link a stock, ETF, or other ticker.