


Baker Hughes Co Stock (BKR) Moved Down by 5.92% on Sep 10: Drivers Behind the Movement



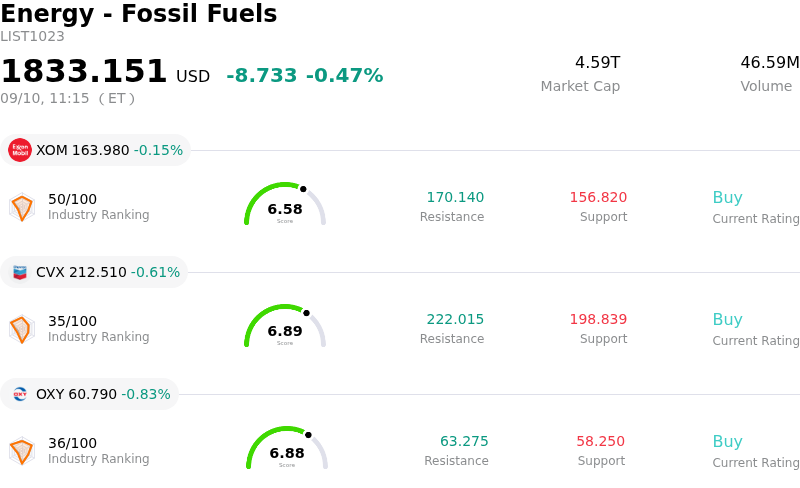
Baker Hughes Co (BKR) moved down by 5.92%. The Energy - Fossil Fuels sector is down by 0.47%. The company underperformed the industry. Top 3 stocks by turnover in the sector: Exxon Mobil Corp (XOM) down 0.15%; Chevron Corp (CVX) down 0.61%; Occidental Petroleum Corp (OXY) down 0.83%.
What is driving Baker Hughes Co (BKR)’s stock price down today?
The downward pressure on Baker Hughes shares stems primarily from investor reaction to the company's updated financial guidance and presentation at the Barclays Energy-Power Conference. While Baker Hughes raised its full-year top-line revenue and adjusted EBITDA forecasts to reflect the inclusion of newly acquired Chart Industries, the updated outlook highlighted key near-term margin and cash flow headwinds. Management noted that Chart's near-term margin performance is being tempered by sluggish hydrogen demand, project timing considerations in liquefied natural gas equipment, and initial execution expenses. Furthermore, free cash flow conversion projections were adjusted downward to accommodate acquisition-related transaction, interest, and integration costs, prompting short-term investor caution.
Analyst re-evaluations exacerbated the selling sentiment. Wall Street firms began trimming near-term earnings expectations and price targets to account for the softer initial profitability of the acquired assets, even while recognizing long-term cost and commercial synergy targets. Following a robust multi-month rally where the stock had achieved substantial gains year-to-date, the market demonstrated diminished tolerance for near-term integration friction and cash flow dilution, leading to heightened intraday volatility as investors recalibrated valuation expectations against execution risks.
From a broader fundamental perspective, Baker Hughes' core segments remain on firm footing, with standalone guidance for both Oilfield Services and Equipment and Industrial and Energy Technology reiterating operational stability and strong order backlogs. Institutional investors are balancing the immediate margin drag and transaction costs against management's multi-year targets for structural cost synergies and an anticipated recovery in liquefied natural gas equipment orders. Nevertheless, in the immediate term, market participants remain focused on integration risks, creating downward momentum in the stock.
Technical Analysis of Baker Hughes Co (BKR)
Technically, Baker Hughes Co (BKR) shows a MACD (12,26,9) value of -0.696, indicating a neutral signal. The RSI at 38.237 suggests neutral condition and the Williams %R at 92.920 suggests oversold condition. Please monitor closely.
Media Coverage of Baker Hughes Co (BKR)
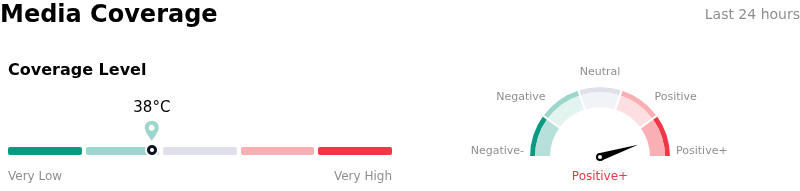
In terms of media coverage, Baker Hughes Co (BKR) shows a coverage score of 38, indicating a low level of media attention. The overall market sentiment index is currently in extremely bullish zone.
Fundamental Analysis of Baker Hughes Co (BKR)
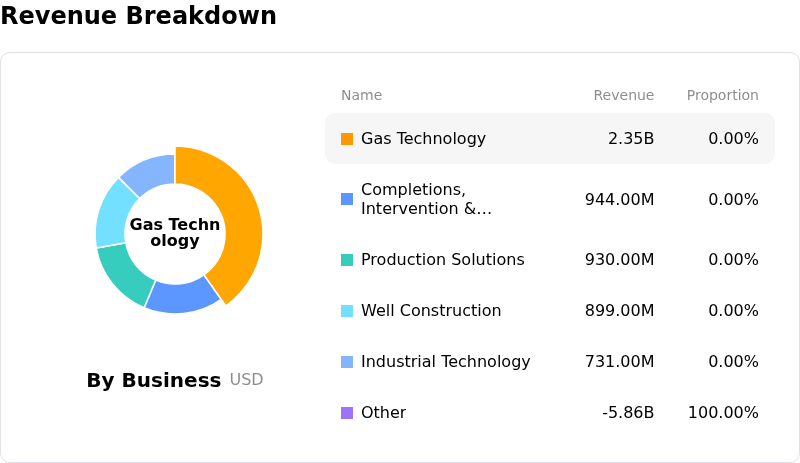
Baker Hughes Co (BKR) is in the Energy - Fossil Fuels industry. Its latest annual revenue is $27.73B, ranking 8 in the industry. The net profit is $2.59B, ranking 10 in the industry. Company Profile
Over the past month, multiple analysts have rated the company as Buy, with an average price target of $72.12, a high of $85.00, and a low of $51.00.
More details about Baker Hughes Co (BKR)
Company Specific Risks:
- Chart Acquisition Integration and Cash Flow Drag: According to an SEC Form 8-K filed on September 9, 2026, incorporating the $13.6 billion acquisition of Chart Industries into FY 2026 guidance reduced projected free cash flow conversion to 40%–45%, as transaction costs, interest burdens, and lower initial margins (~17% in 2H) create a near-term drag on operational cash generation.
- LNG Project Delays and Soft Hydrogen Demand: Management acknowledged at the Barclays Energy-Power Conference on September 9, 2026, that Chart Industries' near-term profitability is being constrained by delayed LNG project sanctions and sluggish customer demand in hydrogen, creating significant operational risk by concentrating 55%–65% of the segment's core profit expectations into Q4 2026.
- Crude Oil Pullback and Upstream Capex Exposure: Recent intraday selling pressure intensified as benchmark crude oil prices dropped over 4% following U.S.-Iran de-escalation and resumed tanker traffic through the Strait of Hormuz, threatening to trigger budget cuts among exploration and production clients that directly impact Baker Hughes' Oilfield Services and Equipment (OFSE) revenue.
- Valuation Multiples and Insider Dispositions: Institutional valuation analysis following the September 9 guidance update highlighted that BKR trades at an elevated P/E ratio of 20.5x compared to its 5-year median of 18.5x, leaving minimal margin of safety while recent insider sales totaling $27.5 million amplify downside volatility risks.
This article may include AI-generated content that is human-reviewed, which is for reference and general information purposes only and does not constitute investment advice.
Recommended Articles







Comments (0)
Click the $ button, enter the symbol, and select to link a stock, ETF, or other ticker.