


Strategy Inc Stock (MSTR) Closed Down by 7.34% on Aug 28: What Signal Does It Send?



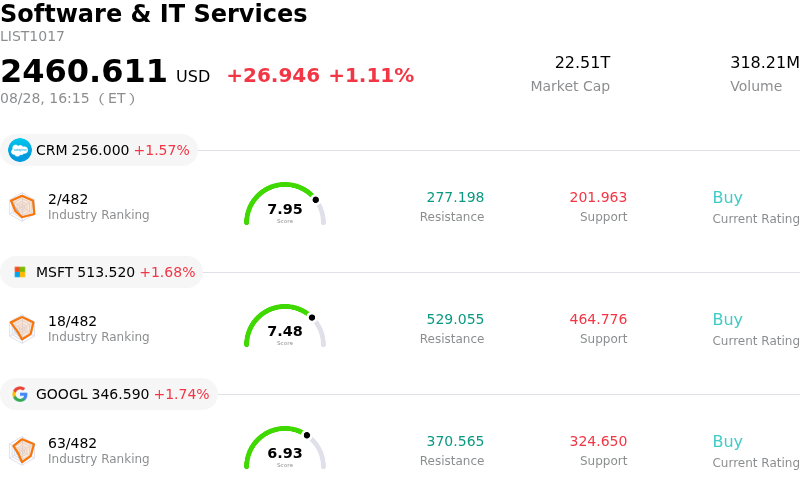
Strategy Inc (MSTR) closed down by 7.34%. The Software & IT Services sector is up by 1.11%. The company underperformed the industry. Top 3 stocks by turnover in the sector: Salesforce Inc (CRM) up 1.57%; Microsoft Corp (MSFT) up 1.68%; Alphabet Inc Class A (GOOGL) up 1.74%.
What is driving Strategy Inc (MSTR)’s stock price down today?
MicroStrategy experienced a notable pullback as short-term profit-taking swept through the high-beta digital asset sector following a multi-day rally. As a primary institutional proxy for Bitcoin, the stock's market trajectory remains intrinsically linked to crypto market dynamics. After testing upper resistance levels earlier in the week, spot Bitcoin momentum cooled off, prompting leveraged traders and institutional investors to trim exposure in underlying equity proxies. The resulting retracement highlights the amplified volatility inherent in MicroStrategy's treasury-focused capital structure.
Equity dilution concerns have also re-emerged to weigh on trader sentiment. The company recently completed substantial share sales under its at-the-market equity program to build out a multi-billion-dollar cash reserve and meet preferred dividend obligations. Although management successfully demonstrated a reduction in net debt risk by expanding its dollar cash pool, the underlying increase in outstanding Class A common shares dilutes per-share asset exposure. Once the initial optimism surrounding balance sheet stabilization was priced in, market participants quickly pivoted to evaluating the long-term impact of share count expansion.
Furthermore, institutional portfolio management at the end of the trading month played a key role in the intraday downward move. Fund managers engaged in profit-locking following the stock's rapid appreciation over prior sessions, reallocating capital toward less volatile equity segments ahead of incoming macroeconomic policy decisions. Given that MicroStrategy frequently trades at a valuation premium relative to its underlying cryptocurrency holdings, periods of stagnant or consolidating crypto prices often spark swift mean-reversion pullbacks.
Looking forward, the stock remains anchored to global digital asset sentiment and the execution of its corporate capital strategy. While the expanded liquidity buffer lowers structural balance sheet leverage, short-term price action will continue to be dictated by Bitcoin spot market movements, option market positioning, and broader investor appetite for high-volatility equity plays.
Technical Analysis of Strategy Inc (MSTR)
Technically, Strategy Inc (MSTR) shows a MACD (12,26,9) value of 7.638, indicating a buy signal. The RSI at 63.044 suggests neutral condition and the Williams %R at 25.918 suggests buy condition. Please monitor closely.
Fundamental Analysis of Strategy Inc (MSTR)
Strategy Inc (MSTR) is in the Software & IT Services industry. Its latest annual revenue is $477.23M, ranking 273 in the industry. The net profit is $-4.23B, ranking 609 in the industry. Company Profile
Over the past month, multiple analysts have rated the company as Buy, with an average price target of $246.96, a high of $645.00, and a low of $125.00.
More details about Strategy Inc (MSTR)
Company Specific Risks:
- Substantial Equity Share Dilution: Form 8-K filings disclosed that the company issued 18.26 million common shares between August 17 and August 23 to raise $2.01 billion, triggering sharp intraday selling pressure as the massive expansion in share count significantly dilutes existing MSTR common equity holders.
- Severe Operating Losses and Impairment Sensitivity: Recent quarterly reporting highlighted a net loss of $8.2 billion ($24.45 per share versus a $2.19 consensus loss estimate) driven by $8.3 billion in digital asset unrealized losses and ongoing operational cash burn, demonstrating that core software revenues fail to offset corporate expenses and balance-sheet write-downs.
- Benchmark Index Exclusion Threat: News surfaced within the past 48 to 72 hours that MSCI Inc. is evaluating index inclusion rules regarding companies heavily concentrated in crypto treasury assets, raising the immediate risk of forced institutional liquidations and passive ETF outflows if MSTR faces exclusion.
- Aggressive Dividend and Debt Cash Drain: Strategy remains burdened by high fixed capital commitments, including maintaining a 12% annualized dividend rate on nearly $10 billion of perpetual preferred stock (STRC) alongside $6.75 billion in total debt, forcing reliance on continuous capital market issuances to sustain cash reserves.
This article may include AI-generated content that is human-reviewed, which is for reference and general information purposes only and does not constitute investment advice.
Recommended Articles









Comments (0)
Click the $ button, enter the symbol, and select to link a stock, ETF, or other ticker.