


Vertiv Holdings Co Stock (VRT) Moved Down by 3.52% on Aug 28: Drivers Behind the Movement



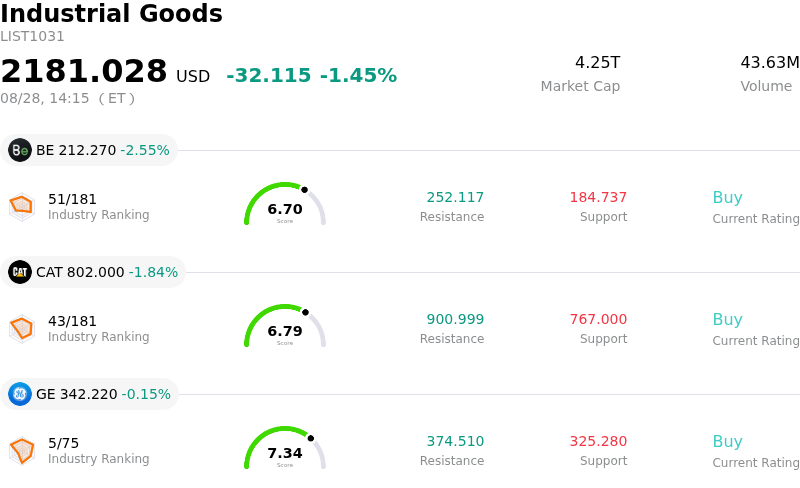
Vertiv Holdings Co (VRT) moved down by 3.52%. The Industrial Goods sector is down by 1.45%. The company underperformed the industry. Top 3 stocks by turnover in the sector: Bloom Energy Corp (BE) down 2.55%; Caterpillar Inc (CAT) down 1.84%; General Electric Co (GE) down 0.15%.
What is driving Vertiv Holdings Co (VRT)’s stock price down today?
Broad market dynamics and sector-wide sentiment across the artificial intelligence ecosystem were key drivers behind the downward pressure on Vertiv Holdings. Following major corporate updates and earnings releases from leading semiconductor bellwethers, investors engaged in tactical profit-taking across AI hardware and data center infrastructure providers. Despite sustained long-term demand for power management and liquid cooling systems essential for high-density computing, high-beta infrastructure stocks faced broader sector headwinds as market participants trimmed exposure following multi-month rallies.
Microeconomic factors and lingering scrutiny surrounding operational execution also weighed on investor confidence. Market sentiment around the stock remains hyper-sensitive following recent quarterly revenue timing shifts, which management attributed to complex multi-phase project deployments and localized supply chain congestion at hyperscale data center sites. News regarding shareholder legal inquiries related to these execution bottlenecks has sustained near-term headline risk, encouraging short-term traders to de-risk positions during periods of heightened market volatility.
Macroeconomic pressures further exacerbated the move lower. Recent fluctuations in benchmark Treasury yields continue to exert downside pressure on growth-oriented capital equipment stocks that trade at premium valuation multiples relative to traditional industrial peers. Rising yield expectations increase the discount rates applied to future cash flows, prompting institutional portfolio managers to execute defensive rebalancing away from richly valued AI infrastructure plays.
From an institutional research perspective, long-term fundamentals remain supported by a robust order backlog, raised full-year sales and operating profit guidance, and ongoing capacity expansions for AI-ready cooling technologies. However, in the short term, high valuation metrics and sensitive execution expectations leave the shares susceptible to sharp pullbacks, sector rotations, and institutional portfolio adjustments during periods of broader market consolidation.
Technical Analysis of Vertiv Holdings Co (VRT)
Technically, Vertiv Holdings Co (VRT) shows a MACD (12,26,9) value of -0.291, indicating a sell signal. The RSI at 43.160 suggests neutral condition and the Williams %R at 80.648 suggests oversold condition. Please monitor closely.
Media Coverage of Vertiv Holdings Co (VRT)
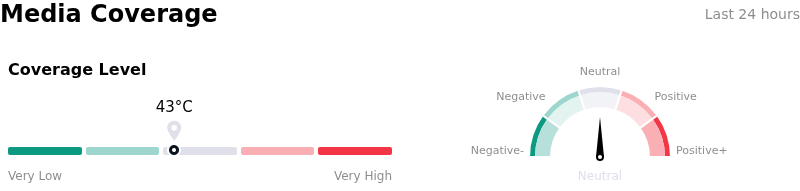
In terms of media coverage, Vertiv Holdings Co (VRT) shows a coverage score of 43, indicating a moderate level of media attention. The overall market sentiment index is currently in neutral zone.
Fundamental Analysis of Vertiv Holdings Co (VRT)
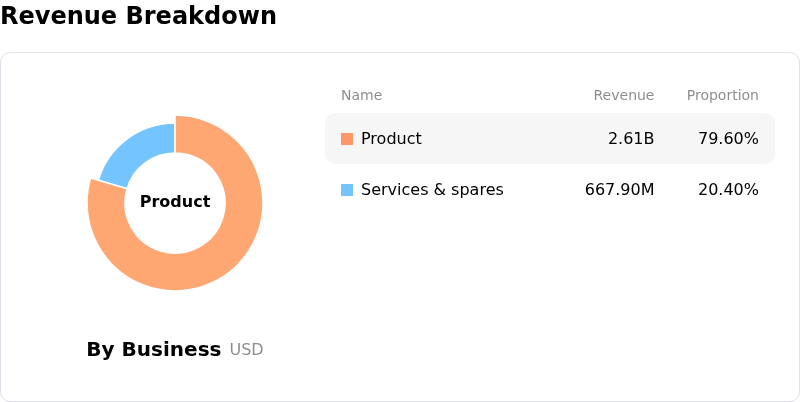
Vertiv Holdings Co (VRT) is in the Industrial Goods industry. Its latest annual revenue is $10.23B, ranking 17 in the industry. The net profit is $1.33B, ranking 13 in the industry. Company Profile
Over the past month, multiple analysts have rated the company as Buy, with an average price target of $331.02, a high of $400.00, and a low of $188.00.
More details about Vertiv Holdings Co (VRT)
Company Specific Risks:
- Project Execution and Revenue Conversion Bottlenecks: Vertiv's latest quarterly revenue missed Wall Street consensus estimates ($3.27 billion reported versus $3.38 billion expected) due to multi-phase deployment delays and temporary supply chain congestion, exposing operational risks in converting its massive order backlog into recognized top-line sales.
- Valuation Vulnerability and Macro Yield Sensitivity: Carrying an elevated trailing price-to-earnings ratio near 58x—substantially above the electrical equipment industry median—the stock faces acute valuation compression and heightened intraday volatility during periods of rising Treasury yields or profit-taking across high-multiple AI infrastructure names.
- Hyperscaler Concentration and AI Capex Dependence: Vertiv's growth narrative is tightly linked to aggressive infrastructure buildouts by a concentrated cluster of cloud hyperscalers, leaving the company heavily exposed to sharp downside shocks if key enterprise customers moderate or defer data center capital expenditures.
- Legal and Operational Capacity Overshoot Risks: Manufacturing capacity has struggled to keep pace with rapid order book expansion for complex liquid cooling systems, while sharp post-earnings equity drawdowns have triggered shareholder class action investigations regarding management's guidance and project timing disclosures.
This article may include AI-generated content that is human-reviewed, which is for reference and general information purposes only and does not constitute investment advice.
Recommended Articles









Comments (0)
Click the $ button, enter the symbol, and select to link a stock, ETF, or other ticker.