


Synopsys Inc Stock (SNPS) Moved Down by 5.11% on Aug 28: Drivers Behind the Movement



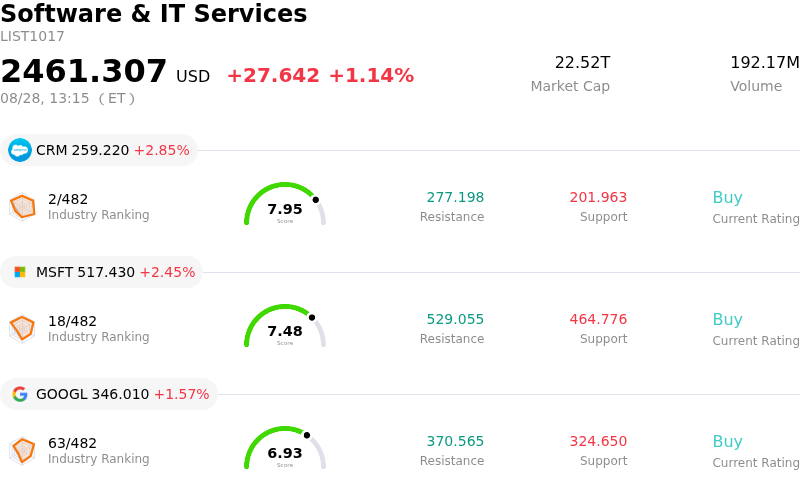
Synopsys Inc (SNPS) moved down by 5.11%. The Software & IT Services sector is up by 1.14%. The company underperformed the industry. Top 3 stocks by turnover in the sector: Salesforce Inc (CRM) up 2.85%; Microsoft Corp (MSFT) up 2.45%; Alphabet Inc Class A (GOOGL) up 1.57%.
What is driving Synopsys Inc (SNPS)’s stock price down today?
Synopsys experienced downward price pressure as market participants digested its third-quarter fiscal 2026 financial report and updated full-year guidance. Although the electronic design automation leader delivered quarterly revenue and adjusted earnings per share that exceeded consensus estimates while lifting its full-year outlook, the magnitude of the forecast raise failed to satisfy the most bullish investor expectations. With elevated valuations leading into the print, the modest nature of the guidance revision triggered a sell-the-news reaction across institutional accounts.
Beyond the earnings release, operational and balance sheet headwinds contributed to the negative sentiment. The company disclosed increased estimated pre-tax restructuring charges related to its global site strategy, driven by higher severance expenses and facility consolidation costs. Additionally, the enlarged balance sheet following the completion of the Ansys acquisition has kept focus on the company's elevated debt burden, raising concerns over integration execution, synergy realization delays, and potential near-term cash flow drag.
Wall Street analyst adjustments have further weighed on market dynamics. Prior to and following the results, several key investment banks lowered their price targets on Synopsys, citing limited near-term valuation upside and ongoing headwinds in legacy software lines. While secular demand for artificial intelligence silicon design tools remains intact, investors appear content to maintain a cautious stance until management provides clearer operational visibility during its upcoming institutional investor events.
Technical Analysis of Synopsys Inc (SNPS)
Technically, Synopsys Inc (SNPS) shows a MACD (12,26,9) value of 11.270, indicating a neutral signal. The RSI at 60.052 suggests neutral condition and the Williams %R at 31.280 suggests buy condition. Please monitor closely.
Media Coverage of Synopsys Inc (SNPS)
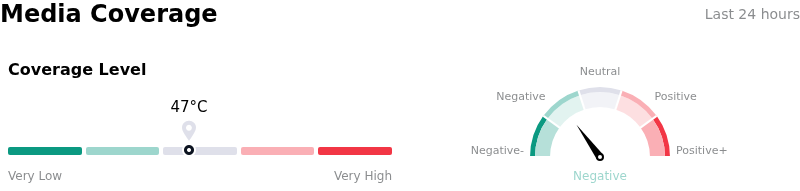
In terms of media coverage, Synopsys Inc (SNPS) shows a coverage score of 47, indicating a moderate level of media attention. The overall market sentiment index is currently in bearish zone.
Fundamental Analysis of Synopsys Inc (SNPS)
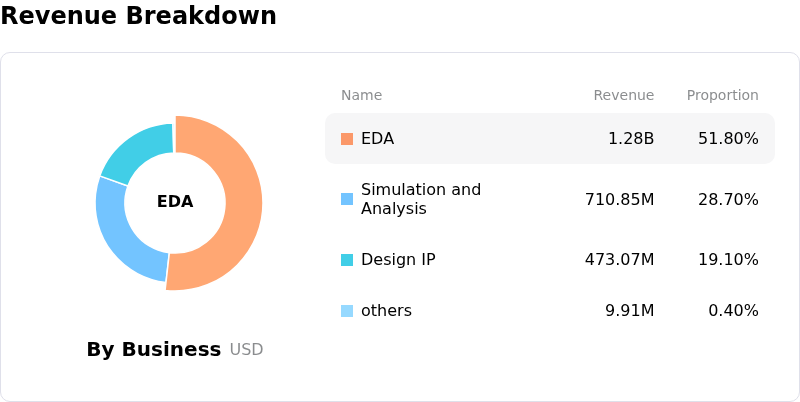
Synopsys Inc (SNPS) is in the Software & IT Services industry. Its latest annual revenue is $7.05B, ranking 46 in the industry. The net profit is $1.33B, ranking 39 in the industry. Company Profile
Over the past month, multiple analysts have rated the company as Buy, with an average price target of $548.11, a high of $633.00, and a low of $414.77.
More details about Synopsys Inc (SNPS)
Company Specific Risks:
- Escalating Restructuring Charges and Layoffs: Disclosures accompanying the Q3 earnings report revealed that Synopsys increased its estimated pre-tax GAAP restructuring charges to between $425 million and $500 million, driven by severe workforce reductions of roughly 10% and widespread facility closures.
- Elevated Debt Burden and Integration Execution Risks: Following the completion of the Ansys acquisition, Synopsys carries approximately $10 billion in long-term debt, raising ongoing institutional concerns regarding balance sheet leverage, elevated interest overhead, and potential delays in achieving targeted cost synergies.
- Sub-Double-Digit Core EDA Growth and Margin Compression: Despite top-line quarter beats, core Electronic Design Automation (EDA) segment revenue grew only 8.5% year-over-year, missing the double-digit threshold expected by institutional analysts, while trailing 12-month net profit margins narrowed from 18.1% to 11.4% under heavy intangible asset amortization.
- Persistent Geopolitical and China Export Vulnerabilities: Institutional commentary continues to highlight revenue vulnerability stemming from stringent U.S. semiconductor export restrictions and policy uncertainty regarding sales licenses in China.
This article may include AI-generated content that is human-reviewed, which is for reference and general information purposes only and does not constitute investment advice.
Recommended Articles









Comments (0)
Click the $ button, enter the symbol, and select to link a stock, ETF, or other ticker.