


Salesforce Inc Stock (CRM) Moved Up by 4.20% on Aug 28: What Investors Need To Know



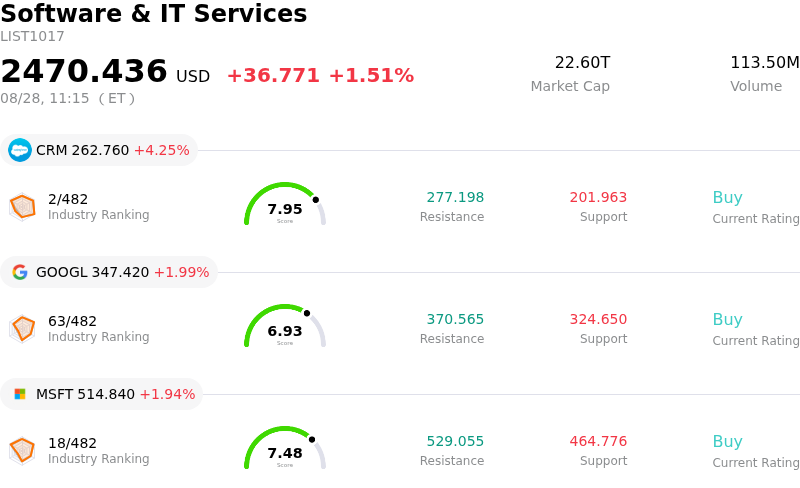
Salesforce Inc (CRM) moved up by 4.20%. The Software & IT Services sector is up by 1.51%. The company outperformed the industry. Top 3 stocks by turnover in the sector: Salesforce Inc (CRM) up 4.20%; Alphabet Inc Class A (GOOGL) up 1.94%; Microsoft Corp (MSFT) up 1.94%.
What is driving Salesforce Inc (CRM)’s stock price up today?
Salesforce experienced notable upward momentum as institutional investors digested stronger-than-expected fiscal second-quarter financial results and an upgraded full-year outlook. The cloud software leader delivered solid top-line revenue growth alongside a substantial earnings beat, driven by rigorous operational discipline, expanding operating margins, and sustained demand across subscription services. Management reaffirmed confidence in the business by lifting full-year revenue and adjusted earnings guidance, signaling that software spending remains resilient and that top-line trajectory is set to reaccelerate into the second half of the fiscal year.
A key catalyst fueling the positive market sentiment is the expanding commercial traction of the company’s artificial intelligence suite, led by Agentforce and Data Cloud. Rapidly expanding annual recurring revenue tied to AI products helped dismantle market concerns that generative artificial intelligence might disintermediate legacy enterprise software platforms. Furthermore, strategic product integrations, including the introduction of Claudeforce in collaboration with Anthropic, have reinforced Salesforce’s value proposition by embedding advanced reasoning models directly into Slack, Tableau, and core workflow systems. This evidence of paid AI adoption demonstrates that enterprise clients are actively upgrading to comprehensive, agentic solutions rather than replacing established customer relationship management architecture.
Cash flow strength and capital deployment strategy further bolstered investor confidence. The company generated exceptional free cash flow growth during the period, driven by high customer retention rates and improved contract terms. Strong balance sheet fundamentals have enabled ongoing aggressive share repurchase programs, which continue to enhance earnings per share growth and signal management’s conviction in intrinsic valuation. As Wall Street analysts respond with price target upgrades and positive forecast revisions, institutional sentiment toward enterprise software has shifted noticeably higher, solidifying Salesforce’s position as a primary beneficiary of enterprise AI deployment.
Technical Analysis of Salesforce Inc (CRM)
Technically, Salesforce Inc (CRM) shows a MACD (12,26,9) value of 10.328, indicating a buy signal. The RSI at 82.017 suggests overbought condition and the Williams %R at 0.000 suggests overbought condition. Please monitor closely.
Media Coverage of Salesforce Inc (CRM)
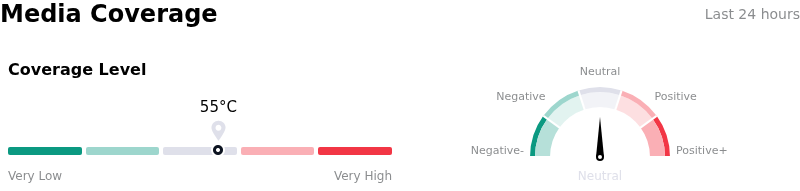
In terms of media coverage, Salesforce Inc (CRM) shows a coverage score of 55, indicating a moderate level of media attention. The overall market sentiment index is currently in neutral zone.
Fundamental Analysis of Salesforce Inc (CRM)
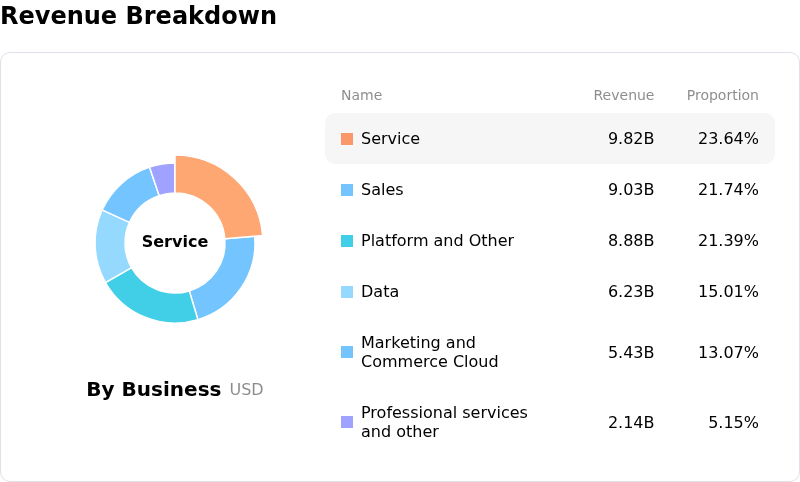
Salesforce Inc (CRM) is in the Software & IT Services industry. Its latest annual revenue is $41.52B, ranking 13 in the industry. The net profit is $7.46B, ranking 15 in the industry. Company Profile
Over the past month, multiple analysts have rated the company as Buy, with an average price target of $271.58, a high of $475.00, and a low of $160.00.
More details about Salesforce Inc (CRM)
Company Specific Risks:
- Non-Operating Gain Inflation: Salesforce's Q2 fiscal 2027 reported adjusted EPS beat of $5.90 was heavily distorted by $2.61 billion in non-operating mark-to-market gains from strategic investments, primarily its Anthropic equity valuation; stripping out these volatile paper gains lowers normalized adjusted EPS to $3.37, exposing core operating sensitivity to venture market fluctuations.
- Sharp Debt Build-Up and Financial Leverage: According to the SEC Form 8-K filing submitted on August 26, 2026, total debt escalated to $39.29 billion from $10.44 billion at the end of the prior fiscal year, substantially increasing balance sheet leverage, interest expense obligations, and financial risk as the company aggressively funds M&A and AI infrastructure.
- Acquisition Dependence and Organic Monetization Lag: Full-year FY2027 revenue guidance of $46.1 billion to $46.4 billion factors in roughly $200 million from inorganic contributions including recent acquisitions like Contentful and Fin, while underlying organic top-line growth of 11% and modest cash flow expansion (~4% to 5%) lag heavy usage metrics, raising analyst skepticism over core AI monetization efficiency.
- Structural Threat to Per-Seat Subscription Model: Institutional analysts remain concerned that long-term enterprise adoption of autonomous agentic software could cannibalize core per-user software licensing, potentially eroding core CRM seat count, pricing power, and long-term operating margins.
This article may include AI-generated content that is human-reviewed, which is for reference and general information purposes only and does not constitute investment advice.
Recommended Articles









Comments (0)
Click the $ button, enter the symbol, and select to link a stock, ETF, or other ticker.