


Nebius Group NV Stock (NBIS) Moved Down by 5.25% on Aug 28: What Signal Does It Send?



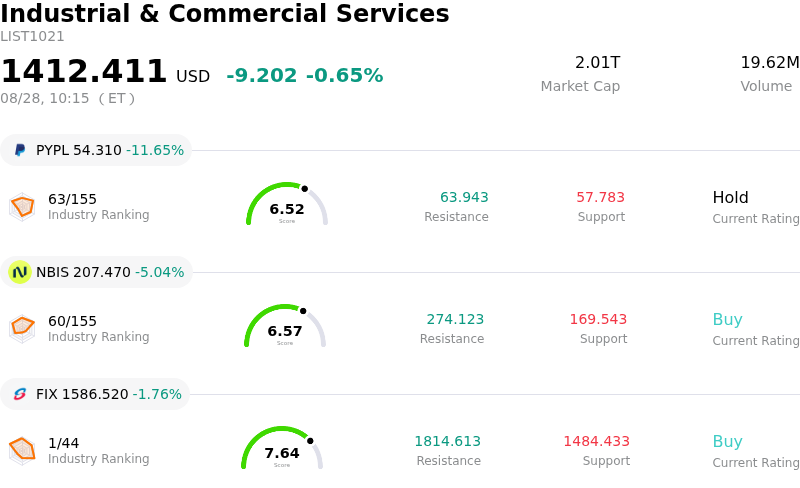
Nebius Group NV (NBIS) moved down by 5.25%. The Industrial & Commercial Services sector is down by 0.65%. The company underperformed the industry. Top 3 stocks by turnover in the sector: PayPal Holdings Inc (PYPL) down 11.65%; Nebius Group NV (NBIS) down 5.04%; Comfort Systems USA Inc (FIX) down 1.76%.
What is driving Nebius Group NV (NBIS)’s stock price down today?
Nebius Group experienced downward pressure accompanied by heightened intraday volatility as investors continue to digest the implications of the company's massive upsized convertible debt financing and adjust positions following recent price swings. The AI cloud infrastructure provider recently closed a significantly enlarged convertible notes offering to fund its aggressive expansion across data centers and graphics processing unit inventory. While the successful transaction ensures ample liquidity for multi-year infrastructure commitments, the sheer magnitude of the debt raise has re-ignited institutional concerns regarding potential equity dilution, elevated leverage, and execution risks tied to capital deployment.
The pullback also reflects profit-taking and valuation recalibration after a period of intense price swings. Following Nebius' recent second-quarter financial results—which demonstrated rapid hyper-growth in AI cloud revenue alongside a net loss due to heavy capital spending—the stock has traded as a high-beta vehicle within the specialized AI infrastructure sector. With financial metrics reflecting ongoing build-out losses and market multiples pricing in aggressive future growth, short-term momentum traders and institutional funds are exercising caution, trimming positions during intraday rallies to manage overall portfolio exposure.
From a strategic perspective, Nebius remains well-positioned within the expanding neocloud ecosystem, supported by strategic partnerships with major hardware vendors and favorable long-term analyst target adjustments. However, in the near term, elevated intraday swings highlight a tug-of-war between long-term fundamental bulls focused on structural demand for computing power and short-term market participants reacting to balance sheet expansion and broader tech sector volatility. Investors will likely require clearer visibility on capital deployment efficiency and revenue conversion from newly funded capacity before the stock establishes a stable upward trajectory.
Technical Analysis of Nebius Group NV (NBIS)
Technically, Nebius Group NV (NBIS) shows a MACD (12,26,9) value of -5.237, indicating a neutral signal. The RSI at 46.696 suggests neutral condition and the Williams %R at 78.529 suggests sell condition. Please monitor closely.
Fundamental Analysis of Nebius Group NV (NBIS)
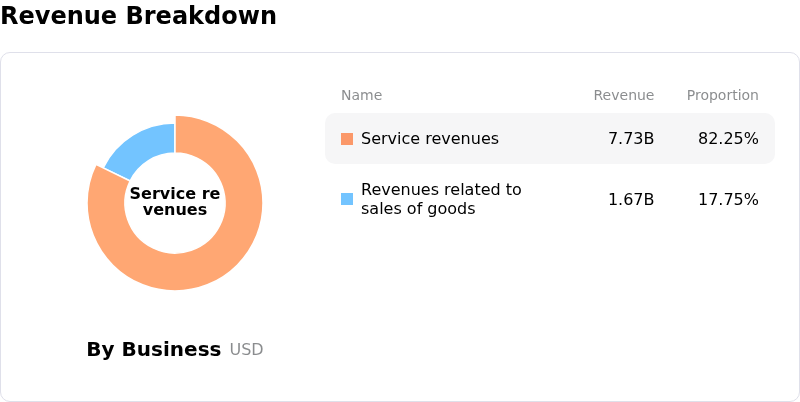
Nebius Group NV (NBIS) is in the Industrial & Commercial Services industry. Its latest annual revenue is $529.80M, ranking 113 in the industry. The net profit is $82.50M, ranking 74 in the industry. Company Profile
Over the past month, multiple analysts have rated the company as Buy, with an average price target of $279.55, a high of $410.00, and a low of $78.34.
More details about Nebius Group NV (NBIS)
Company Specific Risks:
- Dilution and Debt Overhang from $5.75 Billion Convertible Offering: Nebius recently finalized an upsized $5.75 billion convertible senior notes offering and secured shareholder approval for up to a 20% share issuance authorization, stoking investor concerns over substantial equity dilution and debt overhang.
- Escalating Interest Expenses and Heavy Capital Commitments: Capital intensity remains a critical drag on financial performance, highlighted by Q2 interest expenses spiking 2,381% year-over-year to $119.1 million as the company takes on substantial leverage to finance GPU procurement and AI cloud infrastructure.
- Persistent Insider Equity Sales: Recent SEC Form 4 disclosures reveal ongoing insider liquidations, including a company director selling 50,000 Class A shares in August, exacerbating downward pressure and signaling caution during a period of extreme intraday stock volatility.
- Regulatory and Execution Headwinds in Capacity Expansion: Rapid infrastructure scaling exposes Nebius to operational execution risks, including potential power grid interconnect delays, construction cost overruns, and tightening regulatory constraints on high-power data center developments.
This article may include AI-generated content that is human-reviewed, which is for reference and general information purposes only and does not constitute investment advice.
Recommended Articles







Comments (0)
Click the $ button, enter the symbol, and select to link a stock, ETF, or other ticker.