


Bitcoin (BTCUSD) Is down 1.02% on Aug 28: What Do On-Chain Data and Market Sentiment Show?



Bitcoin (BTCUSD) is down 1.02% at Aug 28 05:45(ET), now at $79247.81, with a 7-day up of 2.27%.
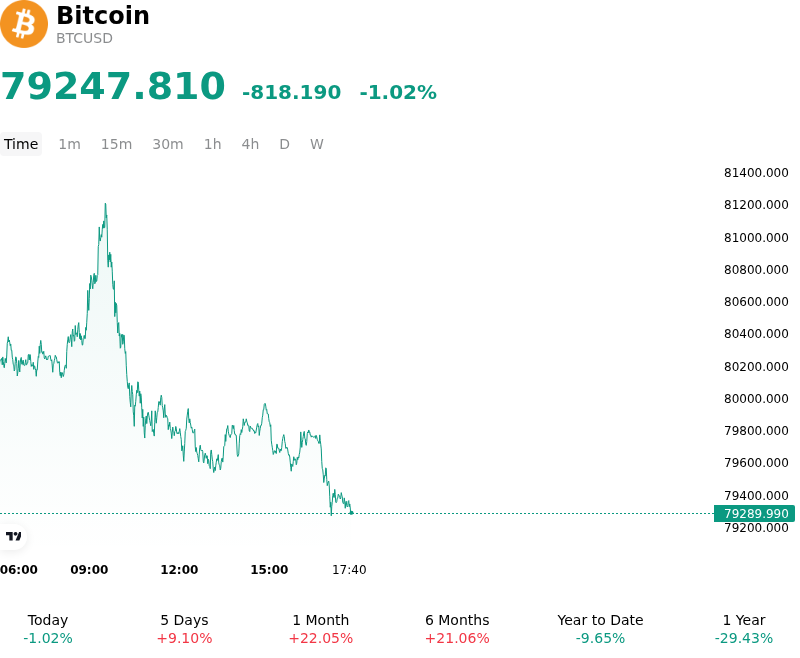
What is driving Bitcoin (BTCUSD)’s stock price down today?
Bitcoin faced intraday downside pressure as market participants engaged in profit-taking following a multi-week rally toward the critical resistance zone between $80,000 and $82,000. After posting substantial monthly gains throughout August, buy-side momentum cooled as institutional investors digested recent upside and adjusted leverage positions. The inability to establish a decisive breakout above major overhead resistance triggered spot selling and prompted tactical traders to lock in gains, causing price action to pull back as desks sought to reduce risk ahead of upcoming macroeconomic catalysts.
From a flow and market structure perspective, the pullback was reinforced by dynamics across spot ETFs and crypto derivatives markets. While spot Bitcoin ETF demand provided a solid structural backstop earlier in the week, intraday capital flows showed signs of moderation as leveraged traders unwound long positions. Derivatives positioning reflected a localized wipeout of late-entering long contracts after the market failed to sustain levels above key psychological thresholds. Additionally, a cautious posture across global macro markets led institutional desks to temporarily trim high-beta risk exposures, dampening immediate buying appetite.
Despite the intraday decline, the movement represents a standard technical consolidation and short-term liquidity repricing following an extended upward expansion rather than a structural deterioration in fundamental demand. Long-term drivers, including broader monetary liquidity conditions, treasury buyback signals, and sustained institutional engagement via spot vehicles, remain intact. Market participants continue to monitor US dollar momentum, Treasury yields, spot ETF flow trajectory, and regulatory developments to gauge the sustainability of the ongoing cycle.
Technical Analysis of Bitcoin (BTCUSD)
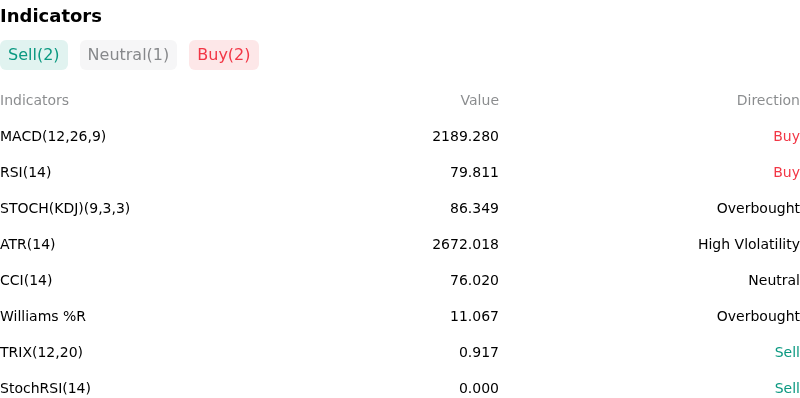
Technically, Bitcoin (BTCUSD) shows a MACD (12,26,9) value of 2189.280, indicating a buy signal. The RSI at 79.811 suggests buy condition and the Williams %R at 11.067 suggests overbought condition. Please monitor closely.
More details about Bitcoin (BTCUSD)
Recent Events and Risks:
- Overhead Resistance and Exchange Profit-Taking: Bitcoin faces severe supply overhead between $81,000 and $86,000, where institutional ETF cost-basis levels and historical supply clusters converge. Recent on-chain data shows short-term holder whales transferred over 43,000 BTC in profit to exchanges, creating aggressive sell-side pressure that risks stalling spot momentum near major resistance.
- Sticky Inflation and Hawkish Policy Re-pricing: The U.S. PCE inflation data released on August 26 printed above target at 3.7% headline and 3.3% core, causing futures markets to elevate September rate hike odds to 44%. The lack of a dovish monetary policy signal strengthens yields and restricts macro liquidity, presenting a persistent headwind for risk assets including BTCUSD.
- Options Expiration and Gamma Hedging Vulnerabilities: With over $6.4 billion in options contracts expiring on August 28 heavily clustered around the $75,000 and $80,000 strike prices, options market positioning is compressing volatility near spot prices. Failure to decisively hold above $80,000 risks triggering dealer delta-hedging flows and unwinding recent spot demand back toward the $76,000 support level.
- Whale Cohort Distribution and Market Depth Concentration: On-chain data indicates that entities holding between 1,000 and 10,000 BTC reduced their balances by approximately 50,500 BTC. This steady divestment by mid-sized whales transfers coins to centralized custodial wrappers, heightening the market's dependence on sustained daily spot ETF inflows to absorb persistent whale-driven spot selling.
This article may include AI-generated content that is human-reviewed, which is for reference and general information purposes only and does not constitute investment advice.
Recommended Articles









Comments (0)
Click the $ button, enter the symbol, and select to link a stock, ETF, or other ticker.